Dolzarb patternlar

Двойная вершина
сформирован 01.04 в 19:35:44 (UTC+0)
сила сигнала 1 из 5
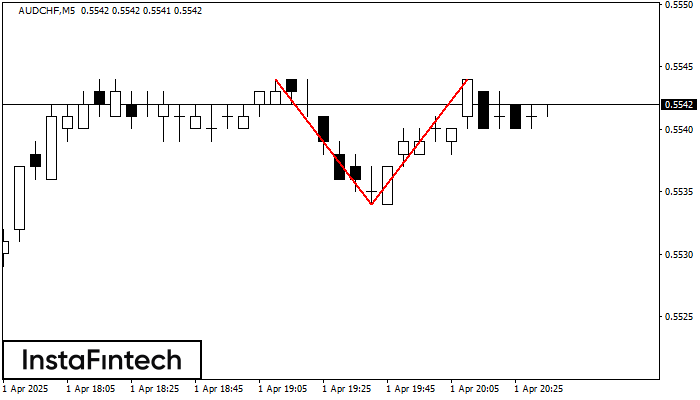
По торговому инструменту AUDCHF на M5 сформировалась фигура «Двойная вершина», которая сигнализирует нам об изменении тенденции с восходящей на нисходящую. Вероятно, что, в случае пробоя основания фигуры 0.5534, возможно дальнейшее нисходящее движение.
Таймфреймы М5 и М15 могут иметь больше ложных точек входа.
Shuningdek ko'ring
- Все
- Все
- Bearish Rectangle
- Bearish Symmetrical Triangle
- Bearish Symmetrical Triangle
- Bullish Rectangle
- Double Top
- Double Top
- Triple Bottom
- Triple Bottom
- Triple Top
- Triple Top
- Все
- Все
- Покупка
- Продажа
- Все
- 1
- 2
- 3
- 4
- 5
Bearish Rectangle
сформирован 11.04 в 22:10:27 (UTC+0)
сила сигнала 1 из 5

According to the chart of M5, USDCAD formed the Bearish Rectangle which is a pattern of a trend continuation. The pattern is contained within the following borders: lower border 1.3871
The M5 and M15 time frames may have more false entry points.
Открыть график инструмента в новом окне
Double Top
сформирован 11.04 в 22:10:22 (UTC+0)
сила сигнала 1 из 5

On the chart of #Bitcoin M5 the Double Top reversal pattern has been formed. Characteristics: the upper boundary 83924.61; the lower boundary 83599.60; the width of the pattern 32501 points
The M5 and M15 time frames may have more false entry points.
Открыть график инструмента в новом окне
Double Top
сформирован 11.04 в 21:55:21 (UTC+0)
сила сигнала 1 из 5
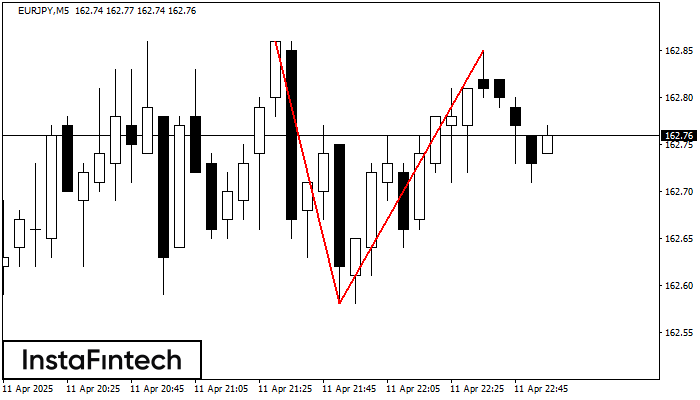
On the chart of EURJPY M5 the Double Top reversal pattern has been formed. Characteristics: the upper boundary 162.85; the lower boundary 162.58; the width of the pattern 27 points
The M5 and M15 time frames may have more false entry points.
Открыть график инструмента в новом окне