Dolzarb patternlar

Двойная вершина
сформирован 11.04 в 22:10:22 (UTC+0)
сила сигнала 1 из 5

На торговом графике #Bitcoin M5 сформировалась разворотная фигура «Двойная вершина». Характеристика: Верхняя граница 83924.61; Нижняя граница 83599.60; Ширина фигуры 32501 пунктов. Сигнал: Пробой нижней границы 83599.60 приведет к дальнейшему нисходящему движению с перспективой хода к уровню 83599.45.
Таймфреймы М5 и М15 могут иметь больше ложных точек входа.
- Все
- Все
- Bearish Rectangle
- Bearish Symmetrical Triangle
- Bearish Symmetrical Triangle
- Bullish Rectangle
- Double Top
- Double Top
- Triple Bottom
- Triple Bottom
- Triple Top
- Triple Top
- Все
- Все
- Покупка
- Продажа
- Все
- 1
- 2
- 3
- 4
- 5
Head and Shoulders
сформирован 25.04 в 11:16:23 (UTC+0)
сила сигнала 2 из 5

The technical pattern called Head and Shoulders has appeared on the chart of USDCHF M15. There are weighty reasons to suggest that the price will surpass the Neckline 0.8293/0.8295 after
The M5 and M15 time frames may have more false entry points.
Открыть график инструмента в новом окне
Double Bottom
сформирован 25.04 в 11:00:37 (UTC+0)
сила сигнала 1 из 5
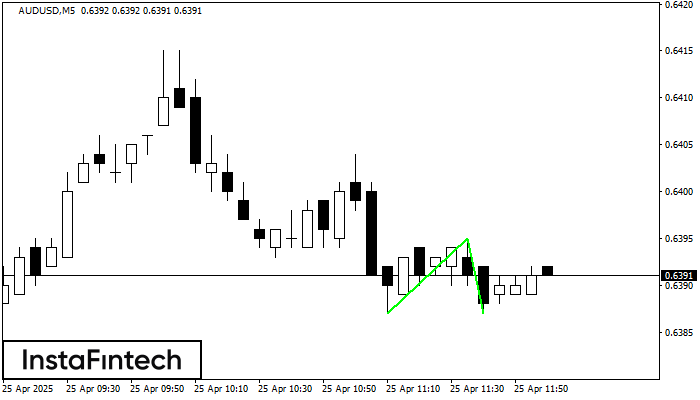
The Double Bottom pattern has been formed on AUDUSD M5. This formation signals a reversal of the trend from downwards to upwards. The signal is that a buy trade should
The M5 and M15 time frames may have more false entry points.
Открыть график инструмента в новом окне
Double Bottom
сформирован 25.04 в 10:50:23 (UTC+0)
сила сигнала 1 из 5
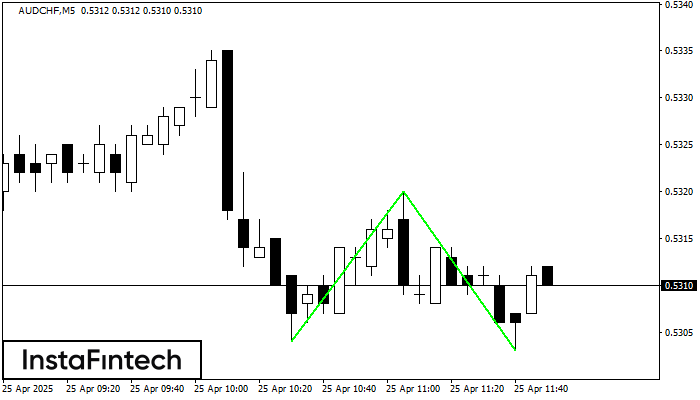
The Double Bottom pattern has been formed on AUDCHF M5. Characteristics: the support level 0.5304; the resistance level 0.5320; the width of the pattern 16 points. If the resistance level
The M5 and M15 time frames may have more false entry points.
Открыть график инструмента в новом окне