Dolzarb patternlar

Бычий симметричный треугольник
сформирован 02.04 в 18:07:59 (UTC+0)
сила сигнала 1 из 5
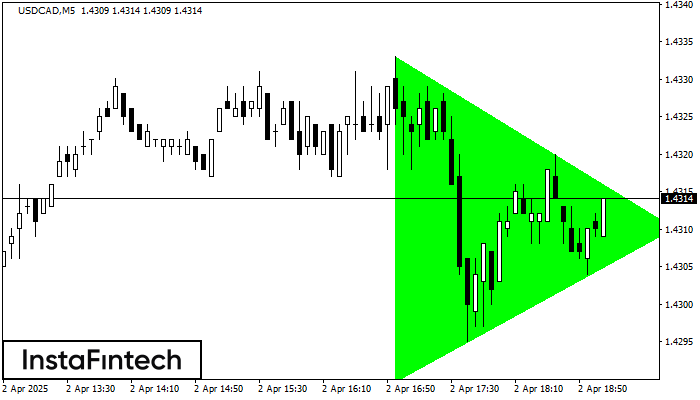
По USDCAD на M5 фигура «Бычий симметричный треугольник». Характеристика: Фигура продолжения тренда; Координаты границ – верхняя 1.4333, нижняя 1.4290. Проекция ширины фигуры 43 пунктов. Прогноз: В случае пробоя верхней границы 1.4333 цена, вероятнее всего, продолжит движение к 1.4325.
Таймфреймы М5 и М15 могут иметь больше ложных точек входа.
- Все
- Все
- Bearish Rectangle
- Bearish Symmetrical Triangle
- Bearish Symmetrical Triangle
- Bullish Rectangle
- Double Top
- Double Top
- Triple Bottom
- Triple Bottom
- Triple Top
- Triple Top
- Все
- Все
- Покупка
- Продажа
- Все
- 1
- 2
- 3
- 4
- 5
Double Top
was formed on 25.04 at 01:45:13 (UTC+0)
signal strength 2 of 5
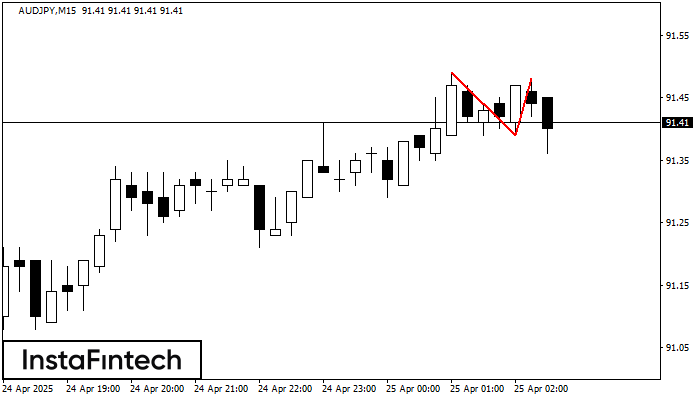
On the chart of AUDJPY M15 the Double Top reversal pattern has been formed. Characteristics: the upper boundary 91.48; the lower boundary 91.39; the width of the pattern 9 points
The M5 and M15 time frames may have more false entry points.
Open chart in a new window
Double Bottom
was formed on 25.04 at 00:30:11 (UTC+0)
signal strength 3 of 5
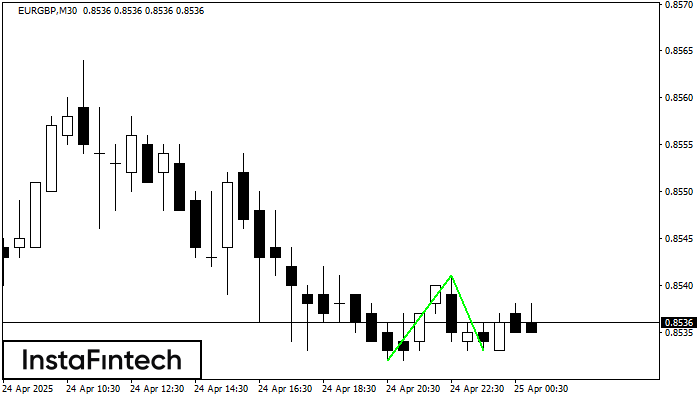
The Double Bottom pattern has been formed on EURGBP M30. Characteristics: the support level 0.8532; the resistance level 0.8541; the width of the pattern 9 points. If the resistance level
Open chart in a new window
Double Top
was formed on 25.04 at 00:30:06 (UTC+0)
signal strength 2 of 5
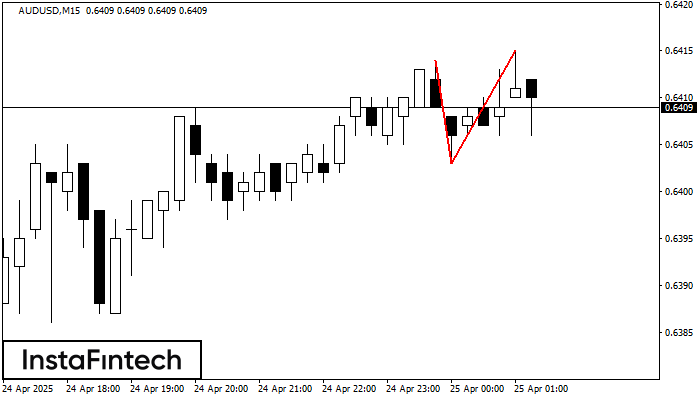
On the chart of AUDUSD M15 the Double Top reversal pattern has been formed. Characteristics: the upper boundary 0.6415; the lower boundary 0.6403; the width of the pattern 12 points
The M5 and M15 time frames may have more false entry points.
Open chart in a new window