

Dolzarb patternlar

Двойное дно
сформирован 02.04 в 00:00:26 (UTC+0)
сила сигнала 3 из 5
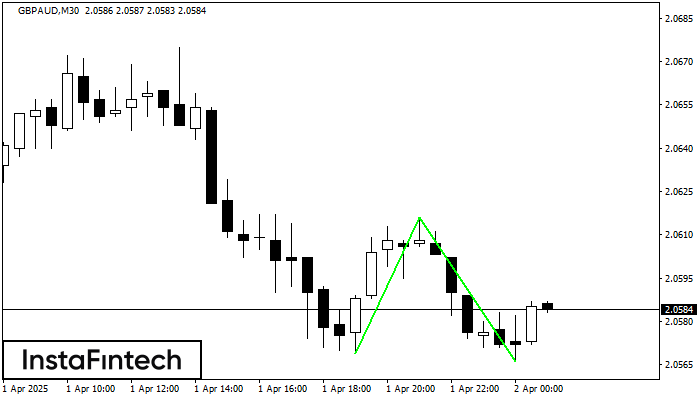
Сформирована фигура «Двойное дно» на графике GBPAUD M30. Верхняя граница 2.0616; Нижняя граница 2.0566; Ширина фигуры 47 пунктов. В случае пробоя верхней границы 2.0616 можно будет прогнозировать изменение тенденции, где ширина фигуры и будет являться расстоянием предположительного Тейк Профита.
Shuningdek ko'ring
- Все
- Все
- Bearish Rectangle
- Bearish Symmetrical Triangle
- Bearish Symmetrical Triangle
- Bullish Rectangle
- Double Top
- Double Top
- Triple Bottom
- Triple Bottom
- Triple Top
- Triple Top
- Все
- Все
- Покупка
- Продажа
- Все
- 1
- 2
- 3
- 4
- 5
Head and Shoulders
сформирован 17.04 в 14:00:03 (UTC+0)
сила сигнала 2 из 5

The technical pattern called Head and Shoulders has appeared on the chart of EURCHF M15. There are weighty reasons to suggest that the price will surpass the Neckline 0.9278/0.9279 after
The M5 and M15 time frames may have more false entry points.
Открыть график инструмента в новом окне
Bearish Symmetrical Triangle
сформирован 17.04 в 13:58:48 (UTC+0)
сила сигнала 1 из 5

According to the chart of M5, GBPUSD formed the Bearish Symmetrical Triangle pattern. Trading recommendations: A breach of the lower border 1.3203 is likely to encourage a continuation
The M5 and M15 time frames may have more false entry points.
Открыть график инструмента в новом окне
Bearish Symmetrical Triangle
сформирован 17.04 в 13:57:41 (UTC+0)
сила сигнала 3 из 5

According to the chart of M30, EURUSD formed the Bearish Symmetrical Triangle pattern. This pattern signals a further downward trend in case the lower border 1.1264 is breached. Here
Открыть график инструмента в новом окне


