Двойная вершина
сформирован 26.03 в 09:45:05 (UTC+0)
сила сигнала 2 из 5

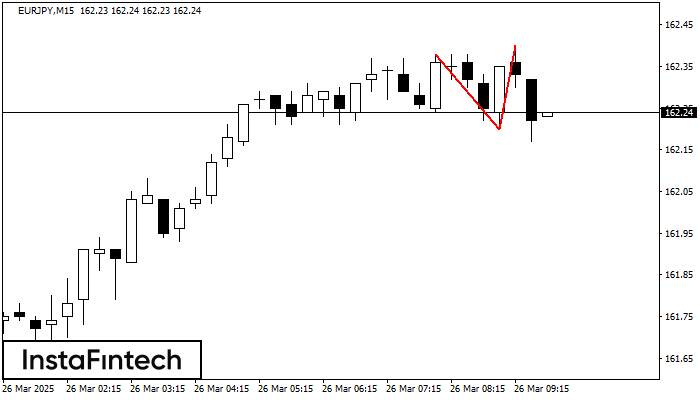
По EURJPY на M15 сформировалась разворотная фигура «Двойная вершина». Характеристика: Верхняя граница 162.38; Нижняя граница 162.20; Ширина фигуры 20 пунктов. Позицию на продажу возможно открыть ниже нижней границы 162.20, с перспективой хода к уровню 161.98.
Таймфреймы М5 и М15 могут иметь больше ложных точек входа.
Shuningdek ko'ring
- Все
- Все
- Bearish Rectangle
- Bearish Symmetrical Triangle
- Bullish Rectangle
- Double Top
- Double Top
- Triple Bottom
- Triple Bottom
- Triple Top
- Triple Top
- Все
- Все
- Покупка
- Продажа
- Все
- 1
- 2
- 3
- 4
- 5
Triple Bottom
сформирован 02.04 в 04:15:26 (UTC+0)
сила сигнала 2 из 5
The Triple Bottom pattern has formed on the chart of the EURCAD M15 trading instrument. The pattern signals a change in the trend from downwards to upwards in the case
The M5 and M15 time frames may have more false entry points.
Открыть график инструмента в новом окне
Double Bottom
сформирован 02.04 в 03:45:26 (UTC+0)
сила сигнала 1 из 5
The Double Bottom pattern has been formed on EURUSD M5. Characteristics: the support level 1.0785; the resistance level 1.0808; the width of the pattern 23 points. If the resistance level
The M5 and M15 time frames may have more false entry points.
Открыть график инструмента в новом окне
Bullish Rectangle
сформирован 02.04 в 02:16:17 (UTC+0)
сила сигнала 1 из 5
According to the chart of M5, NZDJPY formed the Bullish Rectangle which is a pattern of a trend continuation. The pattern is contained within the following borders: the lower border
The M5 and M15 time frames may have more false entry points.
Открыть график инструмента в новом окне