Актуальні патерни

Патерни - це графічні моделі, які "малюють" ціни на графіку. Один з постулатів технічного аналізу говорить нам про те, що історія (рух ціни) завжди повторюється. Це означає, що в схожих ситуаціях рух ціни, найчастіше, буде схожим, що дозволяє з високою часткою ймовірності спрогнозувати подальший розвиток ситуації.
Актуальні патерни від ІнстаФорекс - це зручний сервіс, який дозволить вам завжди бути в курсі останніх змін на ринку і вчасно реагувати на підказки, що з'явилися, від ринку. У нашому сервісі ви завжди знайдете найсвіжіші і актуальніші патерни на будь-якій парі і на будь-якому таймфреймі.
Прямоугольник
сформирован 04.04 в 04:21:33 (UTC+0)
сила сигнала 2 из 5
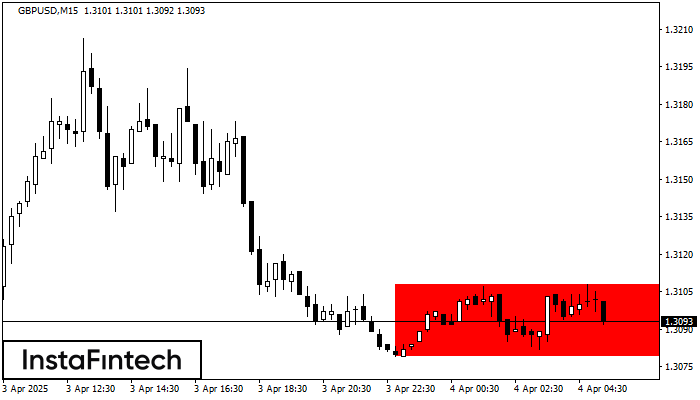
Сформирована фигура «Прямоугольник» на графике GBPUSD M15. Тип фигуры: Продолжение тренда; Границы: Верхняя 1.3108, Нижняя 1.3079; Сигнал: позиция на продажу открывается после фиксации цены ниже границы прямоугольника 1.3079.
Таймфреймы М5 и М15 могут иметь больше ложных точек входа.
- Все
- Все
- Bearish Rectangle
- Bearish Symmetrical Triangle
- Bearish Symmetrical Triangle
- Bullish Rectangle
- Double Top
- Double Top
- Triple Bottom
- Triple Bottom
- Triple Top
- Triple Top
- Все
- Все
- Покупка
- Продажа
- Все
- 1
- 2
- 3
- 4
- 5
Double Top
was formed on 22.04 at 06:46:04 (UTC+0)
signal strength 1 of 5
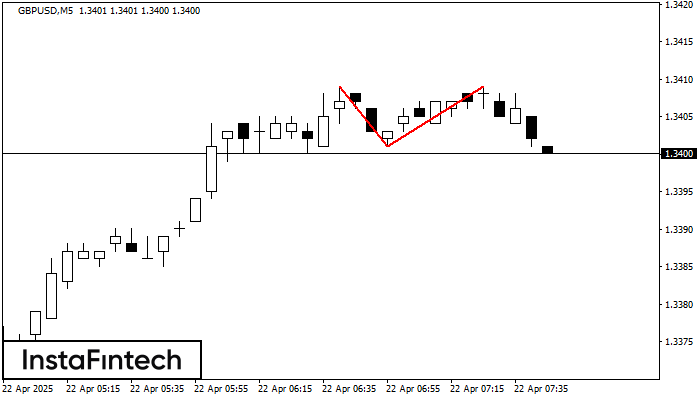
On the chart of GBPUSD M5 the Double Top reversal pattern has been formed. Characteristics: the upper boundary 1.3409; the lower boundary 1.3401; the width of the pattern 8 points
The M5 and M15 time frames may have more false entry points.
Open chart in a new window
Bearish Rectangle
was formed on 22.04 at 06:31:47 (UTC+0)
signal strength 1 of 5
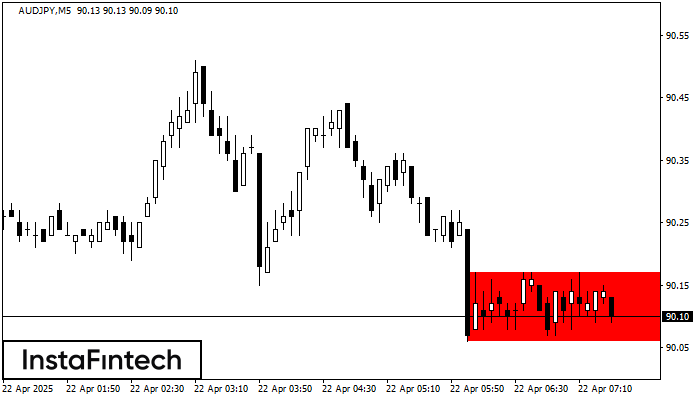
According to the chart of M5, AUDJPY formed the Bearish Rectangle. This type of a pattern indicates a trend continuation. It consists of two levels: resistance 90.17 - 0.00
The M5 and M15 time frames may have more false entry points.
Open chart in a new window
Double Bottom
was formed on 22.04 at 06:10:16 (UTC+0)
signal strength 1 of 5
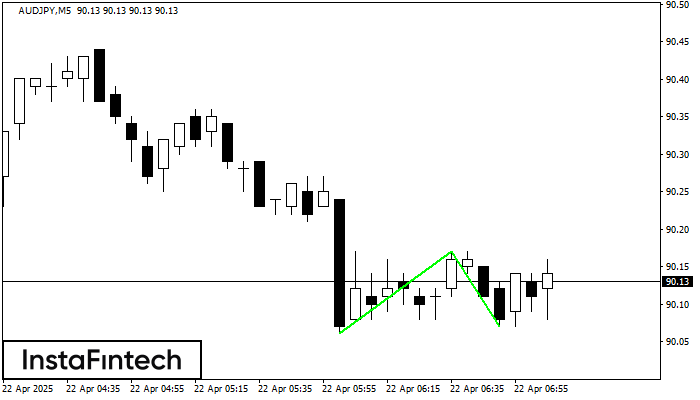
The Double Bottom pattern has been formed on AUDJPY M5. This formation signals a reversal of the trend from downwards to upwards. The signal is that a buy trade should
The M5 and M15 time frames may have more false entry points.
Open chart in a new window