รูปแบบกราฟ

รูปแบบกราฟนั้นเป็น รูปจำลองทางกราฟฟิกที่ถูกสร้างขึ้นมาในชาร์ตจากราคา อ้างอิงตามหนึ่งในการวิเคราะห์ทางเทคนิค ที่ตั้งสมมติฐานมาว่า ประวัติศาสตร์ (การเคลื่อนไหวของราคา) มักจะเกิดขึ้นซ้ำรอยเดิม นั้นหมายความว่า การเคลื่อนไหวของราคาก็หมือนกับ สถานการณ์หนึ่งที่จะสามารถทำการคาดการณ์ไปยังทิศทางในอนาคต ตามเหตุการณ์ที่น่าจะมีความเป็นไปได้สูง
รูปแบบกราฟที่สำคัญจากทาง InstaTrade นั้นจะเป็นการบริการที่มีการใช้อย่างง่ายดาย ซึ่งจะช่วยให้คุณสามารถทราบถึงการเปลี่ยนแปลงล่าสุด ในตลาดได้ และสามารถรับมือกับข้อมูลจากทางตลาดได้ทันท่วงที ในการบริการของพวกเรานั้น คุณจะพบกับรูปแบบกราฟล่าสุดและมีความสำคัญมากที่สุดในทุกๆคู่สกุลเงิน และทุกๆขอบเขตเวลา
Triple Bottom
was formed on 04.04 at 11:25:26 (UTC+0)
signal strength 1 of 5
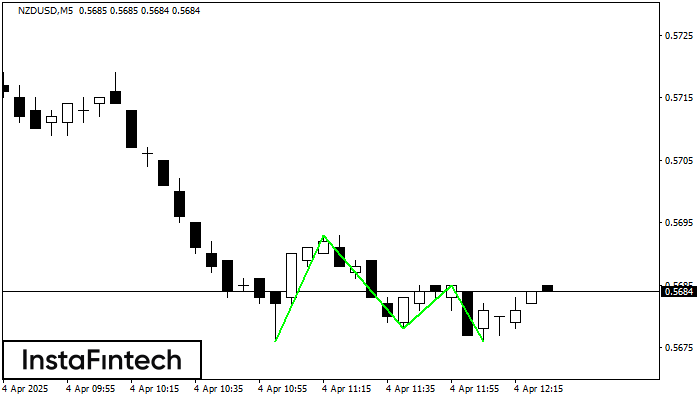
The Triple Bottom pattern has been formed on NZDUSD M5. It has the following characteristics: resistance level 0.5693/0.5685; support level 0.5676/0.5676; the width is 17 points. In the event of a breakdown of the resistance level of 0.5693, the price is likely to continue an upward movement at least to 0.5693.
The M5 and M15 time frames may have more false entry points.
ดูเพิ่มเติม
- All
- All
- Bearish Rectangle
- Bearish Symmetrical Triangle
- Bearish Symmetrical Triangle
- Bullish Rectangle
- Double Top
- Double Top
- Triple Bottom
- Triple Bottom
- Triple Top
- Triple Top
- All
- All
- Buy
- Sale
- All
- 1
- 2
- 3
- 4
- 5
Double Bottom
was formed on 21.04 at 21:10:25 (UTC+0)
signal strength 1 of 5
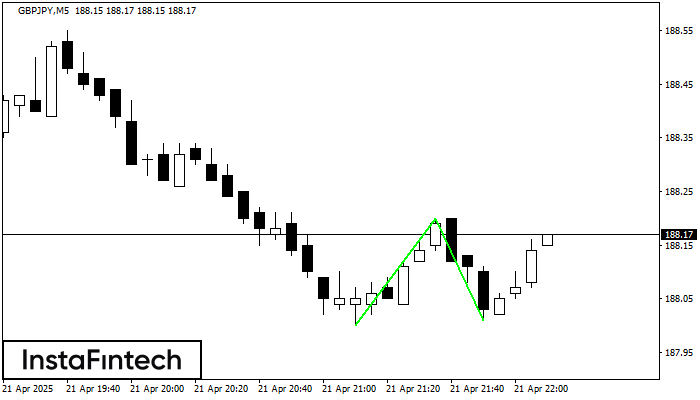
Corak Double Bottom telah dibentuk pada GBPJPY M5. Ciri-ciri: tahap sokongan 188.00; tahap rintangan 188.20; lebar corak 20 mata. Sekiranya tahap rintangan ditembusi, perubahan aliran boleh diramalkan dengan titik sasaran
Carta masa M5 dan M15 mungkin mempunyai lebih banyak titik kemasukan palsu.
Open chart in a new window
Double Top
was formed on 21.04 at 20:31:25 (UTC+0)
signal strength 1 of 5
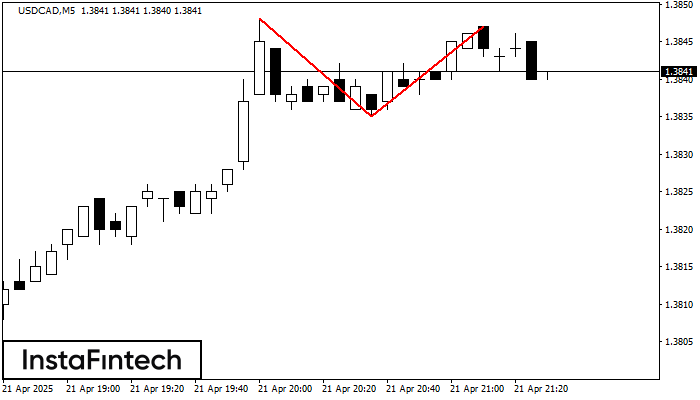
Corak Double Top telah dibentuk pada USDCAD M5. Isyarat bahawa aliran telah berubah dari aliran menaik ke aliran menurun. Mungkin, sekiranya asas corak 1.3835 ditembusi, pergerakan menurun akan berterusan
Carta masa M5 dan M15 mungkin mempunyai lebih banyak titik kemasukan palsu.
Open chart in a new window
Double Bottom
was formed on 21.04 at 20:30:22 (UTC+0)
signal strength 2 of 5
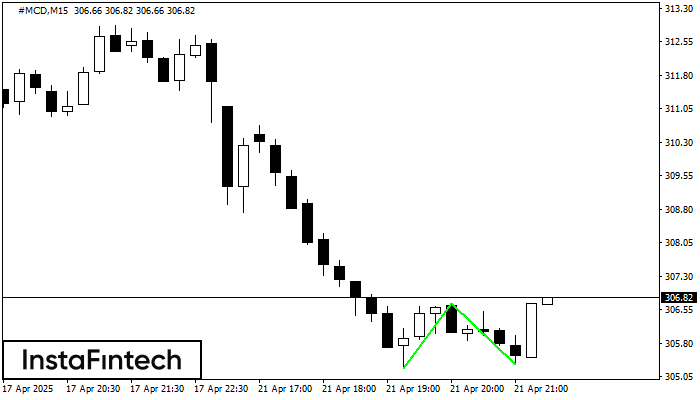
Corak Double Bottom telah dibentuk pada #MCD M15. Ciri-ciri: tahap sokongan 305.24; tahap rintangan 306.70; lebar corak 146 mata. Sekiranya tahap rintangan ditembusi, perubahan aliran boleh diramalkan dengan titik sasaran
Carta masa M5 dan M15 mungkin mempunyai lebih banyak titik kemasukan palsu.
Open chart in a new window