รูปแบบกราฟ

รูปแบบกราฟนั้นเป็น รูปจำลองทางกราฟฟิกที่ถูกสร้างขึ้นมาในชาร์ตจากราคา อ้างอิงตามหนึ่งในการวิเคราะห์ทางเทคนิค ที่ตั้งสมมติฐานมาว่า ประวัติศาสตร์ (การเคลื่อนไหวของราคา) มักจะเกิดขึ้นซ้ำรอยเดิม นั้นหมายความว่า การเคลื่อนไหวของราคาก็หมือนกับ สถานการณ์หนึ่งที่จะสามารถทำการคาดการณ์ไปยังทิศทางในอนาคต ตามเหตุการณ์ที่น่าจะมีความเป็นไปได้สูง
รูปแบบกราฟที่สำคัญจากทาง InstaTrade นั้นจะเป็นการบริการที่มีการใช้อย่างง่ายดาย ซึ่งจะช่วยให้คุณสามารถทราบถึงการเปลี่ยนแปลงล่าสุด ในตลาดได้ และสามารถรับมือกับข้อมูลจากทางตลาดได้ทันท่วงที ในการบริการของพวกเรานั้น คุณจะพบกับรูปแบบกราฟล่าสุดและมีความสำคัญมากที่สุดในทุกๆคู่สกุลเงิน และทุกๆขอบเขตเวลา
Bullish Rectangle
was formed on 02.04 at 14:48:39 (UTC+0)
signal strength 1 of 5
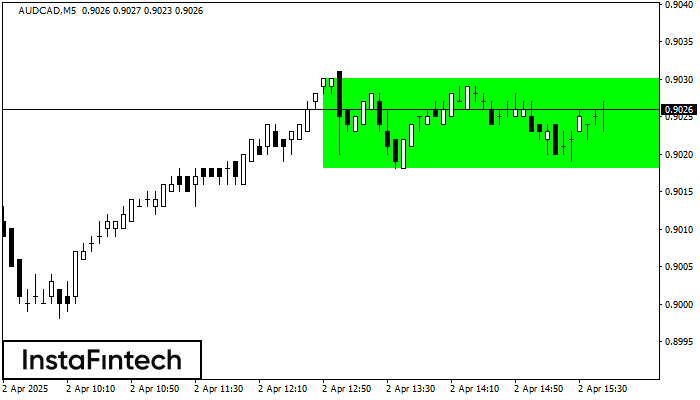
According to the chart of M5, AUDCAD formed the Bullish Rectangle which is a pattern of a trend continuation. The pattern is contained within the following borders: the lower border 0.9018 – 0.9018 and upper border 0.9030 – 0.9030. In case the upper border is broken, the instrument is likely to follow the upward trend.
The M5 and M15 time frames may have more false entry points.
ดูเพิ่มเติม
- All
- All
- Bearish Rectangle
- Bearish Symmetrical Triangle
- Bearish Symmetrical Triangle
- Bullish Rectangle
- Double Top
- Double Top
- Triple Bottom
- Triple Bottom
- Triple Top
- Triple Top
- All
- All
- Buy
- Sale
- All
- 1
- 2
- 3
- 4
- 5
รูปแบบกราฟจุดสองยอดขาลง (Double Bottom)
was formed on 22.04 at 11:50:17 (UTC+0)
signal strength 1 of 5
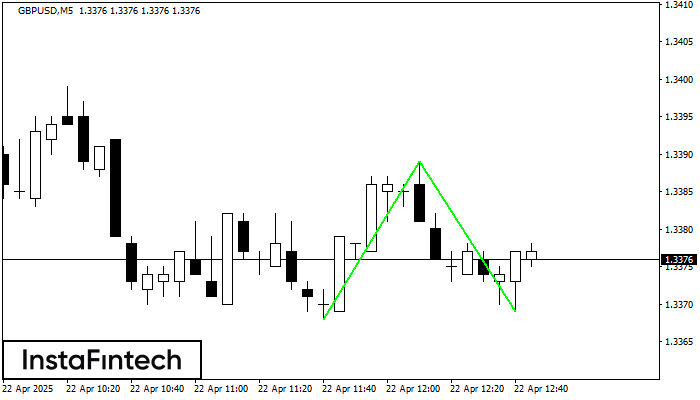
รูปแบบ รูปแบบกราฟจุดสองยอดขาลง (Double Bottom) ถูกสร้างขึ้นมาใน GBPUSD M5; ขอบเขตด้านบนอยู่ที่ 1.3389;ขอบเขตด้านล่าง คือ 1.3369 ความกว้างของรูปแบบนี้คือ 21 จุด กรณีที่มีการเคลื่อนตัวทะลุผ่านขอบเขตด้านบน
ขอบเตระยะเวลาใน M5 และ M15 อาจจะมีตำแหน่งการเข้าใช้งานที่ผิดพลาดมากยิ่งขึ้น
Open chart in a new window
รูปแบบสามเหลี่ยมสมมาตรขาขึ้น (Bullish Symmetrical Triangle)
was formed on 22.04 at 11:39:27 (UTC+0)
signal strength 1 of 5
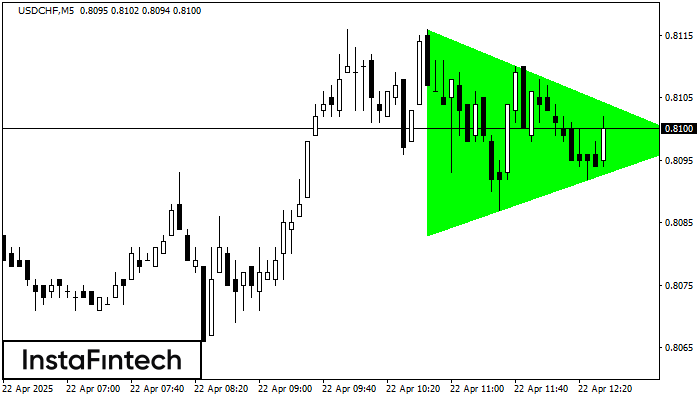
อ้างอิงจากชาร์ตของ M5, USDCHF ที่ได้สร้างรูปแบบ รูปแบบสามเหลี่ยมสมมาตรขาขึ้น (Bullish Symmetrical Triangle) ออกมา ขอบเขตด้านล่างของรูปแบบสัมผัสพิกัด 0.8083/0.8098 แม้ว่าขอบเขตด้านบนจะข้ามผ่าน 0.8116/0.8098 ถ้ารูปแบบ รูปแบบสามเหลี่ยมสมมาตรขาขึ้น
ขอบเตระยะเวลาใน M5 และ M15 อาจจะมีตำแหน่งการเข้าใช้งานที่ผิดพลาดมากยิ่งขึ้น
Open chart in a new window
รูปแบบกราฟจุดสองยอด (Double Top)
was formed on 22.04 at 09:00:07 (UTC+0)
signal strength 4 of 5

รูปแบบ รูปแบบกราฟจุดสองยอด (Double Top) ถูกสร้างขึ้นมาใน NZDCAD H1 มันแสดงให้เห็นว่า แนวโน้มได้มีการเปลี่ยนแปลงจากแนวโน้มขาขึ้น ไปเป็นขาลง บางที ถ้ามีการเคลื่อนตัวทะลุผ่าน ฐานของรูปแบบออกไป 0.8276 การเคลื่อนไหวลงด้านล่างจะยังคงเกิดขึ้น
Open chart in a new window