รูปแบบกราฟ

รูปแบบกราฟนั้นเป็น รูปจำลองทางกราฟฟิกที่ถูกสร้างขึ้นมาในชาร์ตจากราคา อ้างอิงตามหนึ่งในการวิเคราะห์ทางเทคนิค ที่ตั้งสมมติฐานมาว่า ประวัติศาสตร์ (การเคลื่อนไหวของราคา) มักจะเกิดขึ้นซ้ำรอยเดิม นั้นหมายความว่า การเคลื่อนไหวของราคาก็หมือนกับ สถานการณ์หนึ่งที่จะสามารถทำการคาดการณ์ไปยังทิศทางในอนาคต ตามเหตุการณ์ที่น่าจะมีความเป็นไปได้สูง
รูปแบบกราฟที่สำคัญจากทาง InstaTrade นั้นจะเป็นการบริการที่มีการใช้อย่างง่ายดาย ซึ่งจะช่วยให้คุณสามารถทราบถึงการเปลี่ยนแปลงล่าสุด ในตลาดได้ และสามารถรับมือกับข้อมูลจากทางตลาดได้ทันท่วงที ในการบริการของพวกเรานั้น คุณจะพบกับรูปแบบกราฟล่าสุดและมีความสำคัญมากที่สุดในทุกๆคู่สกุลเงิน และทุกๆขอบเขตเวลา
Double Top
was formed on 01.04 at 19:35:44 (UTC+0)
signal strength 1 of 5
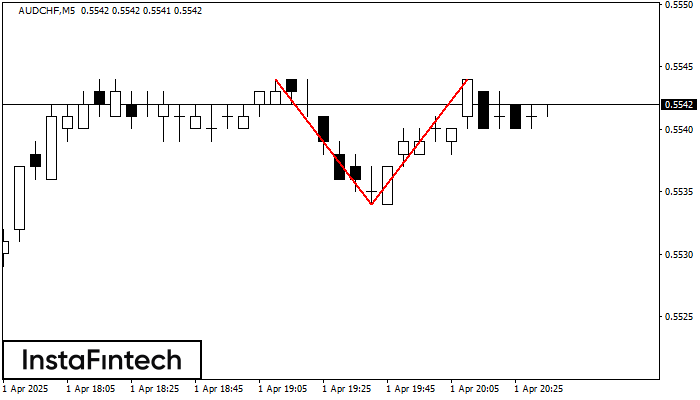
The Double Top pattern has been formed on AUDCHF M5. It signals that the trend has been changed from upwards to downwards. Probably, if the base of the pattern 0.5534 is broken, the downward movement will continue.
The M5 and M15 time frames may have more false entry points.
- All
- All
- Bearish Rectangle
- Bearish Symmetrical Triangle
- Bearish Symmetrical Triangle
- Bullish Rectangle
- Double Top
- Double Top
- Triple Bottom
- Triple Bottom
- Triple Top
- Triple Top
- All
- All
- Buy
- Sale
- All
- 1
- 2
- 3
- 4
- 5
Double Top
сформирован 22.04 в 21:25:11 (UTC+0)
сила сигнала 1 из 5

On the chart of #Bitcoin M5 the Double Top reversal pattern has been formed. Characteristics: the upper boundary 91658.42; the lower boundary 91095.99; the width of the pattern 56243 points
The M5 and M15 time frames may have more false entry points.
Открыть график инструмента в новом окне
Bearish Symmetrical Triangle
сформирован 22.04 в 21:15:28 (UTC+0)
сила сигнала 1 из 5

According to the chart of M5, EURNZD formed the Bearish Symmetrical Triangle pattern. Description: The lower border is 1.9072/1.9108 and upper border is 1.9137/1.9108. The pattern width is measured
The M5 and M15 time frames may have more false entry points.
Открыть график инструмента в новом окне
Double Top
сформирован 22.04 в 20:40:40 (UTC+0)
сила сигнала 1 из 5
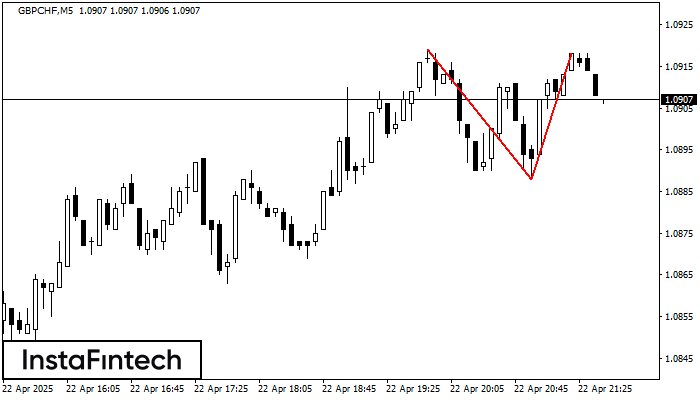
The Double Top pattern has been formed on GBPCHF M5. It signals that the trend has been changed from upwards to downwards. Probably, if the base of the pattern 1.0888
The M5 and M15 time frames may have more false entry points.
Открыть график инструмента в новом окне
Bearish Rectangle
сформирован 22.04 в 20:19:28 (UTC+0)
сила сигнала 1 из 5
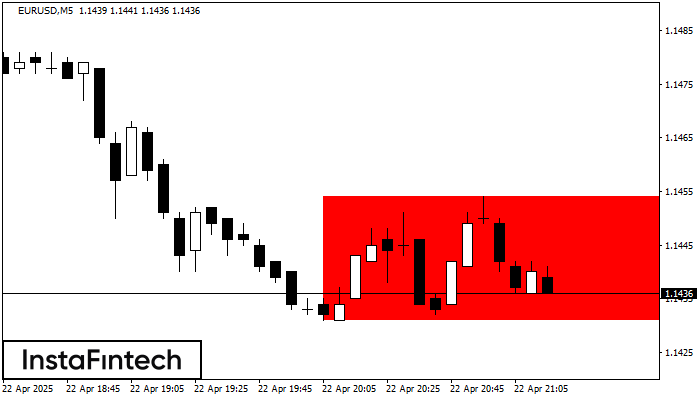
According to the chart of M5, EURUSD formed the Bearish Rectangle. The pattern indicates a trend continuation. The upper border is 1.1454, the lower border is 1.1431. The signal means
The M5 and M15 time frames may have more false entry points.
Открыть график инструмента в новом окне
Bullish Symmetrical Triangle
сформирован 22.04 в 20:06:01 (UTC+0)
сила сигнала 1 из 5
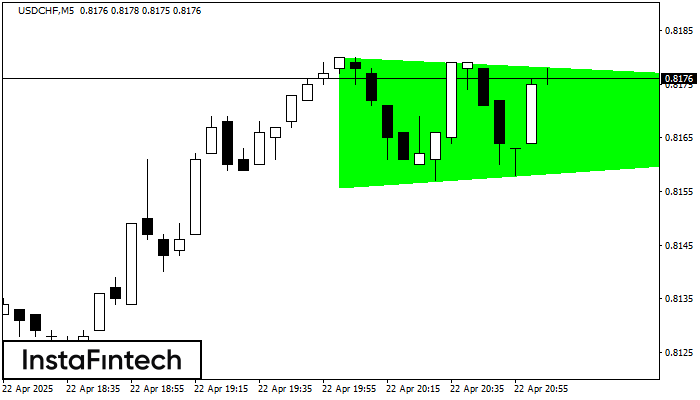
According to the chart of M5, USDCHF formed the Bullish Symmetrical Triangle pattern, which signals the trend will continue. Description. The upper border of the pattern touches the coordinates 0.8180/0.8170
The M5 and M15 time frames may have more false entry points.
Открыть график инструмента в новом окне
Bullish Rectangle
сформирован 22.04 в 20:05:56 (UTC+0)
сила сигнала 1 из 5
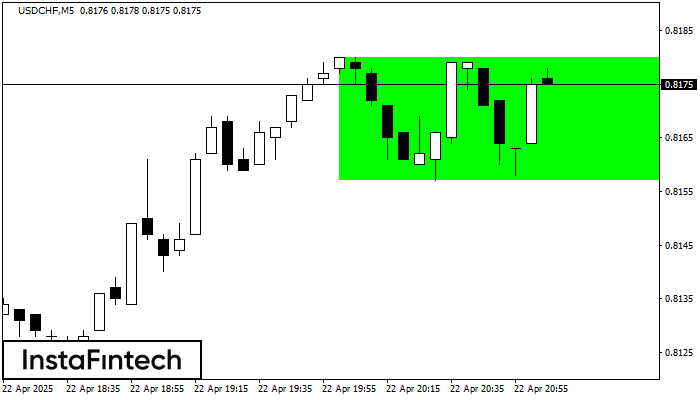
According to the chart of M5, USDCHF formed the Bullish Rectangle which is a pattern of a trend continuation. The pattern is contained within the following borders: the lower border
The M5 and M15 time frames may have more false entry points.
Открыть график инструмента в новом окне
Double Bottom
сформирован 22.04 в 20:00:25 (UTC+0)
сила сигнала 1 из 5
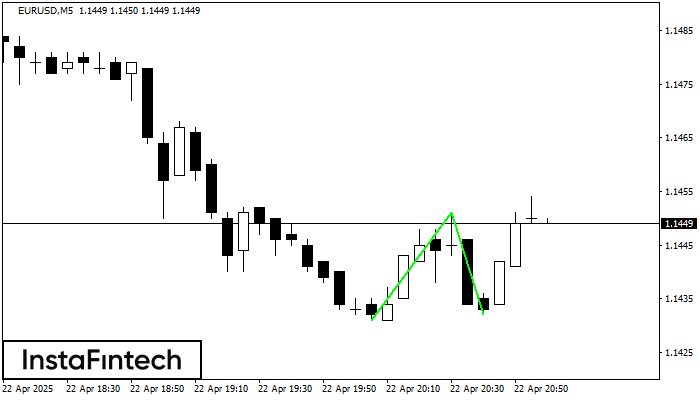
The Double Bottom pattern has been formed on EURUSD M5; the upper boundary is 1.1451; the lower boundary is 1.1432. The width of the pattern is 20 points. In case
The M5 and M15 time frames may have more false entry points.
Открыть график инструмента в новом окне
Double Bottom
сформирован 22.04 в 19:15:32 (UTC+0)
сила сигнала 1 из 5
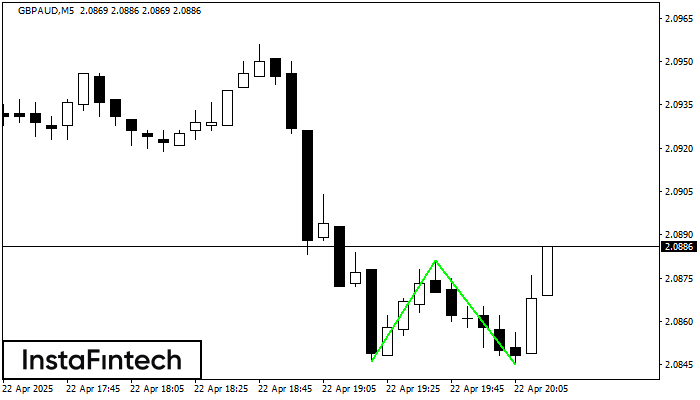
The Double Bottom pattern has been formed on GBPAUD M5; the upper boundary is 2.0881; the lower boundary is 2.0845. The width of the pattern is 35 points. In case
The M5 and M15 time frames may have more false entry points.
Открыть график инструмента в новом окне
Triple Top
сформирован 22.04 в 19:15:08 (UTC+0)
сила сигнала 1 из 5
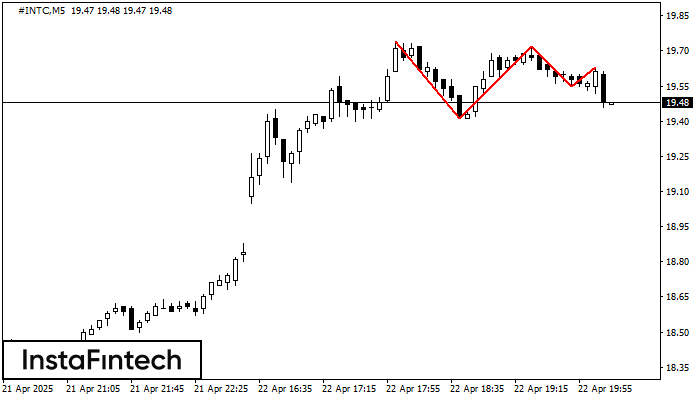
The Triple Top pattern has formed on the chart of the #INTC M5. Features of the pattern: borders have an ascending angle; the lower line of the pattern
The M5 and M15 time frames may have more false entry points.
Открыть график инструмента в новом окне