

รูปแบบกราฟ

รูปแบบกราฟนั้นเป็น รูปจำลองทางกราฟฟิกที่ถูกสร้างขึ้นมาในชาร์ตจากราคา อ้างอิงตามหนึ่งในการวิเคราะห์ทางเทคนิค ที่ตั้งสมมติฐานมาว่า ประวัติศาสตร์ (การเคลื่อนไหวของราคา) มักจะเกิดขึ้นซ้ำรอยเดิม นั้นหมายความว่า การเคลื่อนไหวของราคาก็หมือนกับ สถานการณ์หนึ่งที่จะสามารถทำการคาดการณ์ไปยังทิศทางในอนาคต ตามเหตุการณ์ที่น่าจะมีความเป็นไปได้สูง
รูปแบบกราฟที่สำคัญจากทาง InstaTrade นั้นจะเป็นการบริการที่มีการใช้อย่างง่ายดาย ซึ่งจะช่วยให้คุณสามารถทราบถึงการเปลี่ยนแปลงล่าสุด ในตลาดได้ และสามารถรับมือกับข้อมูลจากทางตลาดได้ทันท่วงที ในการบริการของพวกเรานั้น คุณจะพบกับรูปแบบกราฟล่าสุดและมีความสำคัญมากที่สุดในทุกๆคู่สกุลเงิน และทุกๆขอบเขตเวลา
Triple Top
was formed on 31.03 at 04:00:43 (UTC+0)
signal strength 2 of 5
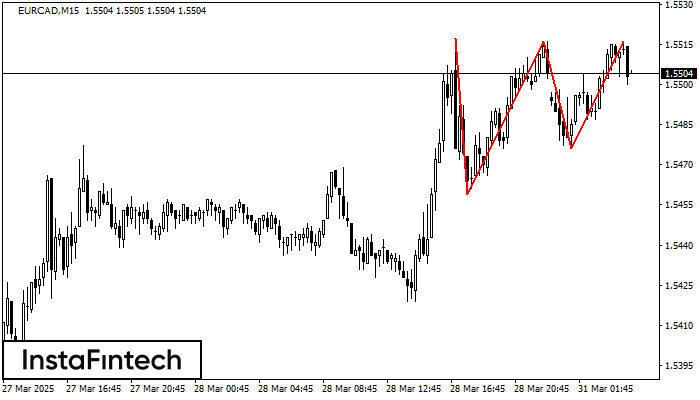
The Triple Top pattern has formed on the chart of the EURCAD M15 trading instrument. It is a reversal pattern featuring the following characteristics: resistance level 1, support level -17, and pattern’s width 58. Forecast If the price breaks through the support level 1.5459, it is likely to move further down to 1.5494.
The M5 and M15 time frames may have more false entry points.
- All
- All
- Bearish Rectangle
- Bearish Symmetrical Triangle
- Bearish Symmetrical Triangle
- Bullish Rectangle
- Double Top
- Double Top
- Triple Bottom
- Triple Bottom
- Triple Top
- Triple Top
- All
- All
- Buy
- Sale
- All
- 1
- 2
- 3
- 4
- 5
รูปแบบกราฟจุดสองยอด (Double Top)
was formed on 22.04 at 04:35:45 (UTC+0)
signal strength 1 of 5

รูปแบบการย้อนตัว รูปแบบกราฟจุดสองยอด (Double Top) ได้ถูกสร้างขึ้นมาใน NZDCHF M5 คุณลักษณะ: ขอบเขตด้านบน 0.4869; ขอบเขตด้านล่าง 0.4861; ความกว้างของกราฟรูปแบบนี้คือ 7 จุด
ขอบเตระยะเวลาใน M5 และ M15 อาจจะมีตำแหน่งการเข้าใช้งานที่ผิดพลาดมากยิ่งขึ้น
Open chart in a new window
รูปแบบกราฟธงขาลง (Bearish Flag)
was formed on 22.04 at 04:22:30 (UTC+0)
signal strength 1 of 5

รูปแบบ รูปแบบกราฟธงขาลง (Bearish Flag) ได้สร้างขึ้นมาในชาร์ต SILVER M5 ดังนั้นแนวโน้มขาลงอาจจะยังคงเกิดขึ้นในระยะเวลาอันสั้นนี้ จนกว่าราคาเคลื่อนตัวทะลุผ่านต่ำกว่าระดับต่ำที่ 32.48 เทรดเดอร์ควรจะเข้าไปยังตลาด
ขอบเตระยะเวลาใน M5 และ M15 อาจจะมีตำแหน่งการเข้าใช้งานที่ผิดพลาดมากยิ่งขึ้น
Open chart in a new window
รูปแบบกราฟธงปลายแหลมขาลง (Bearish pennant)
was formed on 22.04 at 04:22:25 (UTC+0)
signal strength 1 of 5
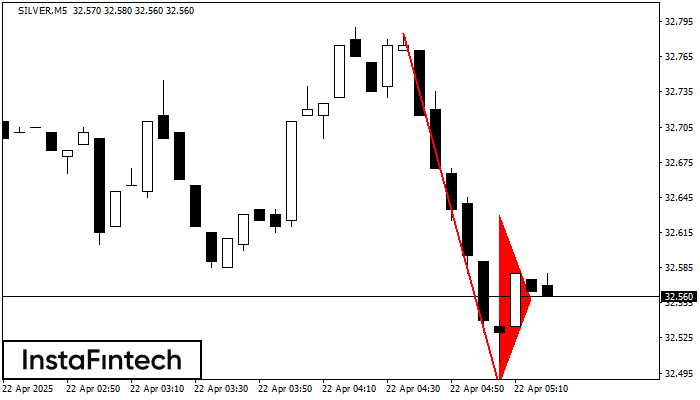
รูปแบบ รูปแบบกราฟธงปลายแหลมขาลง (Bearish pennant) ได้สร้างขึ้นมาในชาร์ต SILVER M5 รูปแบบประเภทนี้จัดว่าเป็นการชะลอตัวลงเล็กน้อย หลังจากที่ราคาจะเคลื่อนตัว ไปในทิศทางของแนวโน้มเดิม กรณีที่ราคาทรงตัวอยู่ต่ำกว่าระดับต่ำของรูปแบบใน 32.48 เทรดเดอร์ก็จะสามารถเข้าไปถึงสถานะการขายได้สำเร็จ
ขอบเตระยะเวลาใน M5 และ M15 อาจจะมีตำแหน่งการเข้าใช้งานที่ผิดพลาดมากยิ่งขึ้น
Open chart in a new window


