อ่านรายละเอียดเพิ่มเติม


 26.04.2023 12:26 AM
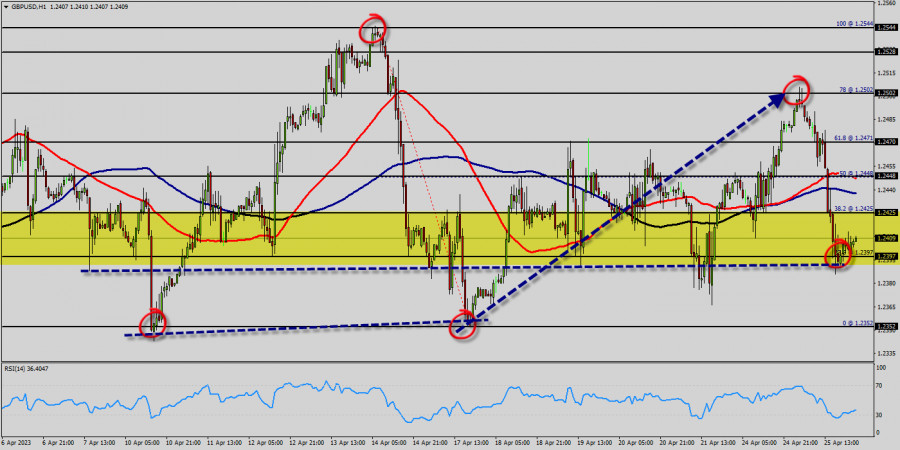
The bullish trend is currently very strong on The GBP/USD pair. As long as the price remains above the support levels of 1.2397, you could try to benefit from the growth. The first bullish objective is located at the price of 1.2425. The bullish momentum would be boosted by a break in this resistance (1.2425).
The hourly chart is currently still bullish. At the same time, some stabilization tendencies are visible between 1.2397 and 1.2035. Together with the relatively large distance to the fast-rising 100-day moving average (1.2035), there are some arguments for a relief rally in coming months on the table.
The GBP/USD pair is at highest against the dollar around the spot of 1.2035 since last week. The GBP/USD pair is inside in upward channel. For some weeks the GBP/USD pair decreased within an up channel, for that the GBP/USD pair its new highest 1.2067. Consequently, the first support is set at the level of 1.2035. Hence, the market is likely to show signs of a bullish trend around the area of 1.2000 and 1.2035.
RSI is seeing major support above 33% and a bullish divergence vs price also signals that a reversal is impending. According to the previous events the price is expected to remain between 1.2425 and 1.2397 levels. Buyers would then use the next resistance located at 1.2067 as an objective. Crossing it would then enable buyers to target 1.2502 (the double top - last bullish week).
Be careful, given the powerful bullish rally underway, excesses could lead to a possible correction in the short term. If this is the case, remember that trading against the trend may be riskier. It would seem more appropriate to wait for a signal indicating reversal of the trend. The GBP/USD pair has plunged up for a fresh two weeks high.
Prices pushed above a key retracement from a Fibonacci setup that spans from the lowest price of 1.2397 (23.6% of Fibonacci on the hourly chart), for that buyer pulled the bid back-above that level by the end of the week.
This week, the GBP/USD pair traded up and closed the day in the red area near the price of 1.2397. Today it rose a little, rising above 1.2397. If the pair succeeds in passing through the level of 1.2425, the market will indicate the bullish opportunity above the level of 1.2425 in order to reach the second target at 1.2501.
In the very short term, the general bullish sentiment is confirmed by technical indicators. Therefore, a small upwards rebound in the very short term could occur in case of excessive bearish movements. The trend is still bullish as long as the price of 1.2397 is not broken. Thereupon, it would be wise to re-buy above the price of at 1.2397 with the objective of 1.2352. We should see the pair climbing towards the next target of 1.2300. The pair will move upwards continuing the development of the bullish trend to the level 1.2501 or 1.2544 in coming days.
You have already liked this post today
*บทวิเคราะห์ในตลาดที่มีการโพสต์ตรงนี้ เพียงเพื่อทำให้คุณทราบถึงข้อมูล ไม่ได้เป็นการเจาะจงถึงขั้นตอนให้คุณทำการซื้อขายตาม
คู่สกุลกำลังเคลื่อนไหวในกรอบแคบๆ ใต้ระดับแนวต้านที่ 1.1345 รอคอยผลการประชุมนโยบายการเงินของ Fed ซึ่งจะสรุปในวันพุธที่ 7 พฤษภาคม หาก Fed ตัดสินใจคงอัตราดอกเบี้ยหลักไว้ตามที่คาดการณ์ไว้ในขณะนี้ และแสดงความสงสัยเกี่ยวกับความเป็นไปได้ในการลดอัตราดอกเบี้ยในเดือนมิถุนายน คู่สกุลนี้อาจถูกกดดันและลดลงได้ ในแง่ของเทคนิค คู่สกุลนี้กำลังเคลื่อนไหวในกรอบด้านข้างระหว่าง
เมื่อวันศุกร์ คู่ EUR/USD ขยับขึ้นไปถึงระดับ 1.1374 แล้วดีดตัวออกมา กลับเป็นการเสริมค่าให้กับดอลลาร์สหรัฐอีกครั้ง ฝ่ายหมีจู่โจมอีกครั้ง แต่เพียงระยะเวลาสั้น ๆ และโดยรวมแล้วพวกเขายังคงค่อนข้างอ่อนแอ ดังนั้น ตามสถานการณ์ปัจจุบัน แนวโน้มขาขึ้นยังคงอยู่ การดีดตัวใหม่จากระดับ
ในกราฟรายชั่วโมง คู่สกุลเงิน GBP/USD ได้ลดลงต่อในวันศุกร์มุ่งหน้าสู่ระดับการปรับฐาน Fibonacci 161.8% ที่ 1.3249 การดีดตัวจากระดับนี้จะเป็นประโยชน์ต่อปอนด์อังกฤษและอาจนำไปสู่การเติบโตบางส่วนไปสู่ระดับ 1.3357 การปิดต่ำกว่าระดับ 1.3249 จะเพิ่มโอกาสในการลดลงต่อไปยังระดับ 1.3149 แนวโน้มขาขึ้นยังคงอยู่ในปัจจุบัน
ลิงก์ที่เป็นประโยชน์: บทความอื่นๆ ของฉันสามารถอ่านได้ในส่วนนี้ คอร์ส InstaForex สำหรับผู้เริ่มต้น การวิเคราะห์ยอดนิยม เปิดบัญชีการซื้อขาย สำคัญ: ผู้เริ่มต้นในตลาดซื้อขาย Forex ต้องระมัดระวังในการตัดสินใจเข้าตลาดเป็นอย่างมาก ก่อนการประกาศรายงานสำคัญ ควรหลีกเลี่ยงการเข้าตลาด เพื่อหลีกเลี่ยงการถูกจับอยู่ในสภาวะตลาดที่มีการแกว่งตัวรุนแรงเนื่องจากความผันผวนที่เพิ่มขึ้น
เมื่อปรากฏรูปแบบ Failing Wedge ในกราฟ 4 ชั่วโมง มันบ่งบอกว่าในอนาคตอันใกล้มีศักยภาพที่จะพุ่งไปสู่ระดับ 3297.43 และหากโมเมนตัมและความผันผวนอำนวย, ราคาทองคำจะเสริมความแข็งแกร่งอีกครั้งไปสู่ระดับ 3343.81 แต่หากในระหว่างทางไปสู่ระดับเหล่านี้ เกิดการแก้ไขการอ่อนตัวที่พุ่งผ่านและปิดต่ำกว่าระดับ 3201.44 ก็จะทำให้แผนการเสริมความแข็งแกร่งที่ได้กล่าวไว้ก่อนหน้าถูกยกเลิกและถือว่าเป็นโมฆะเองโดยอัตโนมัติ
หากพิจารณากราฟ 4 ชั่วโมงของคู่เงิน EUR/JPY ดูเหมือนว่าในอนาคตอันใกล้ EUR/JPY มีแนวโน้มที่จะแข็งค่าขึ้น ซึ่งได้รับการยืนยันจากการปรากฏของรูปแบบ Convergence ระหว่างการเคลื่อนไหวของราคาคู่เงิน EUR/JPY กับตัวชี้วัด Stochastic Oscillator และการเคลื่อนไหวของราคาคู่เงิน
ในช่วงต้นของตลาดอเมริกา ราคาทองคำซื้อขายอยู่ที่ประมาณ 3,223 ปรับตัวขึ้นหลังจากที่ลงมาถึงระดับต่ำสุดของ 5/8 Murray ประมาณ 3,203 คาดว่าทองคำจะยังคงฟื้นตัวต่อไปในอีกไม่กี่ชั่วโมงข้างหน้า อย่างไรก็ตาม เราอาจคาดว่าน่าจะมีการปรับฐานเกิดขึ้น เนื่องจากราคาเครื่องมือทางเทคนิคนี้ดูเหมือนจะอยู่ในสถานะที่ขายมากเกินไป ราคาทองคำอาจซื้อขายอยู่ระหว่าง 3,203 และอาจลงมาถึงก้นช่องขาลงที่ประมาณ
ในช่วงต้นของตลาดอเมริกา คู่สกุลเงิน EUR/USD กำลังซื้อขายอยู่ที่ประมาณ 1.1378 ภายในช่องแนวโน้มขาลงที่เกิดขึ้นเมื่อวันที่ 17 เมษายน และแสดงสัญญาณของการหมดพลังของแนวโน้มขาขึ้น มีความเป็นไปได้ที่จะเกิดการปรับฐานทางเทคนิคในอีกไม่กี่ชั่วโมงข้างหน้า และค่าเงินยูโรอาจร่วงลงไปยังจุดต่ำสุดของช่องแนวโน้มประมาณ 1.1150 ค่าเงินยูโรคงตัวอยู่หลายวันรอบๆ บริเวณ 1.1370
ลิงก์ที่มีประโยชน์: บทความอื่นๆของฉันสามารถหาอ่านได้ในส่วนนี้ คอร์ส InstaForex สำหรับผู้เริ่มต้น การวิเคราะห์ยอดนิยม เปิดบัญชีซื้อขาย สำคัญ: ผู้เริ่มต้นในตลาดฟอเร็กซ์จำเป็นต้องระมัดระวังเป็นอย่างยิ่งเมื่อตัดสินใจเข้าสู่ตลาด ก่อนการรายงานข้อมูลสำคัญควรหลีกเลี่ยงการเข้าตลาดเพื่อป้องกันการเผชิญกับความผันผวนที่เพิ่มขึ้นในตลาด ซึ่งอาจทำให้เกิดความผันผวนของราคาอย่างรุนแรง หากคุณตัดสินใจที่จะซื้อขายในช่วงที่มีการประกาศข่าว ควรตั้งคำสั่งหยุดขาดทุนเสมอเพื่อที่จะลดการสูญเสียให้น้อยที่สุด ถ้าไม่ได้ตั้งคำสั่งหยุดขาดทุน คุณอาจสูญเสียเงินฝากทั้งหมดได้อย่างรวดเร็ว
สมาชิกInstaForex

Your IP address shows that you are currently located in the USA. If you are a resident of the United States, you are prohibited from using the services of InstaFintech Group including online trading, online transfers, deposit/withdrawal of funds, etc.
If you think you are seeing this message by mistake and your location is not the US, kindly proceed to the website. Otherwise, you must leave the website in order to comply with government restrictions.
Why does your IP address show your location as the USA?
Please confirm whether you are a US resident or not by clicking the relevant button below. If you choose the wrong option, being a US resident, you will not be able to open an account with InstaTrade anyway.
We are sorry for any inconvenience caused by this message.

