อ่านรายละเอียดเพิ่มเติม


 09.04.2023 06:02 PM
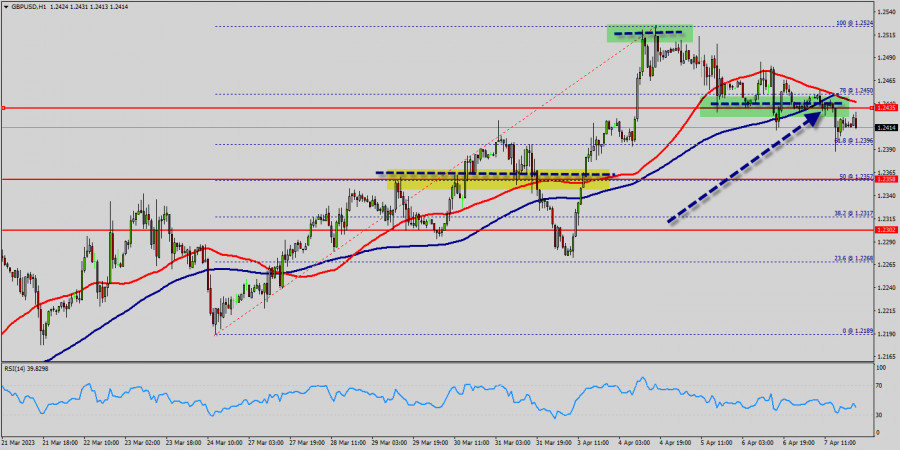
The GBP/USD pair broke resistance which turned to strong support at the level of 1.2302 yesterday. The level of 1.2302 coincides with a golden ratio (38.2% of Fibonacci : 1.2317), which is expected to act as major support today. The Relative Strength Index (RSI) is considered overbought because it is above 30. The RSI is still signaling that the trend is upward as it is still strong above the moving average (100).
This suggests the pair will probably go up in coming hours. This support has been rejected for three times confirming uptrend veracity. Hence, major support is seen at the level of 1.2302 because the trend is still showing strength above it.
The Relative Strength Index (RSI) is considered oversold because it is above 35. At the same time, the RSI is still signaling an upward trend, as the trend is still showing strong above the moving average (100), this suggests the pair will probably go up in coming hours.
Accordingly, the market is likely to show signs of a bullish trend. In other words, buy orders are recommended above 1.2302 with the first target at the level of 1.2358. From this point, the pair is likely to begin an ascending movement to the point of 1.2358 and further to the level of 1.2435.
The level of 1.2435 will act as strong resistance and the double top is already set at the point of 1.2435. On the other hand, if a breakout happens at the support level of 1.2302, then this scenario may become invalidated.
Conclusion :
We should see the pair climbing towards the next target of 1.2435. The pair will move upwards continuing the development of the bullish trend to the level 1.2435 and 1.2500 in coming days.
On the other hand, in case a reversal takes place and the GBP/USD pair breaks through the support level of 1.2302, a further decline to 1.2260 can occur. It would indicate a bearish market.
You have already liked this post today
*บทวิเคราะห์ในตลาดที่มีการโพสต์ตรงนี้ เพียงเพื่อทำให้คุณทราบถึงข้อมูล ไม่ได้เป็นการเจาะจงถึงขั้นตอนให้คุณทำการซื้อขายตาม
ในช่วงต้นของเซสชั่นอเมริกา คู่สกุลเงิน EUR/USD กำลังซื้อขายอยู่ที่ระดับ 1.1358 ภายในช่องแนวโน้มขาลงที่เริ่มเมื่อวันที่ 18 เมษายน คู่สกุลเงินนี้ยังถูกกดดันจากแรงขาย เราเชื่อว่าเครื่องมือการเงินนี้ยังมีทางลงอีกยาวไกลกว่าจะถึงก้นของช่องแนวโน้มขาลง ยูโรคาดว่าจะฟื้นตัวในชั่วโมงต่อๆ ไป และขึ้นไปถึงระดับ 1.1429 บนกราฟ
ลิงก์ที่มีประโยชน์: บทความอื่นๆ ของฉันสามารถอ่านได้ในส่วนนี้ คอร์ส InstaForex สำหรับผู้เริ่มต้น การวิเคราะห์ยอดนิยม เปิดบัญชีซื้อขาย สำคัญ: นักลงทุนมือใหม่ในตลาดฟอเร็กซ์จำเป็นต้องระมัดระวังอย่างมากเมื่อตัดสินใจเข้าตลาด ก่อนการเปิดเผยรายงานสำคัญควรหลีกเลี่ยงการเข้าไปในตลาดเพื่อหลบเลี่ยงความผันผวนที่รุนแรง อันเนื่องมาจากความผันแปรที่เพิ่มขึ้น หากคุณตัดสินใจที่จะเทรดในช่วงที่มีการเผยแพร่ข่าวสาร ควรตั้งคำสั่งหยุดขาดทุนเสมอเพื่อช่วยลดความเสี่ยงในการขาดทุน หากไม่มีการตั้งคำสั่งหยุดขาดทุน
ราคาทองคำได้ปรับตัวลดลงอย่างชัดเจนเมื่อเร็วๆ นี้ ท่ามกลางความคาดหวังในตลาดเกี่ยวกับการเริ่มต้นการเจรจาจริงระหว่างสหรัฐฯ และจีน เรื่องภาษีและการค้าภาพรวม คำแถลงของรัฐมนตรีคลัง S. Bessent ที่กล่าวว่าการทำสงครามภาษีในปัจจุบันระหว่างปักกิ่งและวอชิงตันไม่มีประโยชน์ บ่งบอกว่าการเจรจากำลังเกิดขึ้นเบื้องหลัง และอาจมีการบรรลุข้อตกลงในอนาคตอันใกล้นี้ ในทางเทคนิค ราคาของ "โลหะสีเหลือง" มีการกลับตัวลงในท้องถิ่น
ในกราฟ 4 ชั่วโมง เครื่องมือที่ใช้สำหรับการซื้อขายเงิน (Silver) แสดงให้เห็นสภาพที่กำลังแข็งแกร่งขึ้น ซึ่งยืนยันได้จากการเคลื่อนไหวของราคาเงินที่เคลื่อนที่อยู่เหนือเส้น WMA (30 Shift 2) ที่มีแนวโน้มขึ้น แต่การปรากฎของ Divergence ระหว่างการเคลื่อนที่ของราคาและตัวบ่งชี้
แม้ว่าในกราฟ 4 ชั่วโมง ดัชนี Nasdaq 100 จะอยู่ในทิศทาง Sideways แต่ช่วงช่วงนั้นค่อนข้างกว้างจึงยังมีโอกาสที่ค่อนข้างน่าสนใจในดัชนีนี้ ขณะนี้ตัวชี้วัด Stochastic Oscillator อยู่ในสภาวะ Crossing SELL
ในช่วงต้นของตลาดสหรัฐฯ ทองคำมีการซื้อขายอยู่ที่ประมาณ 3,333 ภายในช่องขาลงที่เกิดขึ้นเมื่อวันที่ 22 เมษายน XAU/USD แสดงสัญญาณของการขายเกินและกำลังกระเด้งหลังจากถึงระดับ Murray 6/8 และพื้นที่ 200 EMA ทองคำอาจจะยังคงอยู่ในแนวโน้มขาลง ถ้ามันลดลงต่ำกว่า
ด้วยการเกิดความแตกต่างระหว่างการเคลื่อนไหวของราคาในคู่สกุลเงิน AUD/JPY กับตัวบ่งชี้ Stochastic Oscillator และการเคลื่อนไหวของราคา AUD/JPY ที่อยู่เหนือ WMA (30 Shift 2) ซึ่งมีแนวโน้มสูงขึ้น ดังนั้นอิงตามข้อเท็จจริงทั้งสองข้อนี้ AUD/JPY
หากเราพิจารณากราฟ 4 ชั่วโมง จะเห็นว่าเครื่องมือการเงิน Gold ยังคงเคลื่อนไหวในแนวโน้ม Bullish แต่การปรากฏของ Divergence ระหว่างการเคลื่อนไหวของราคาทองคำกับตัวชี้วัด Stochastic Oscillator บ่งบอกว่าในอนาคตอันใกล้นี้ ทองคำอาจเผชิญการปรับฐานอ่อนตัวลงไปสู่ระดับ 3310.31
ลิงก์ที่เป็นประโยชน์: บทความอื่นๆ ของฉันสามารถอ่านได้ในส่วนนี้ คอร์สพื้นฐาน InstaForex สำหรับผู้เริ่มต้น การวิเคราะห์ยอดนิยม เปิดบัญชีซื้อขาย สำคัญ: สำหรับผู้เริ่มต้นในการเทรดฟอเร็กซ์ ควรระมัดระวังเป็นพิเศษเมื่อทำการตัดสินใจเกี่ยวกับการเข้าสู่ตลาด ก่อนที่รายงานสำคัญจะออก ควรหลีกเลี่ยงการเข้าตลาดเพื่อป้องกันการถูกกระทบจากความผันผวนของตลาดที่เพิ่มขึ้น หากตัดสินใจเทรดในช่วงที่มีการประกาศข่าว ควรตั้ง
หากเราพิจารณากราฟ 4 ชั่วโมงของคู่สกุลเงิน GBP/CHF จะพบข้อเท็จจริงที่น่าสนใจหลายประการ ประการแรก การปรากฏตัวของรูปแบบ Triangle ตามด้วยการเคลื่อนไหวของ EMA (21) ที่เคลื่อนที่ระหว่างตัวแท่งเทียนบ่งชี้ว่าสถานการณ์ปัจจุบันของ GBP/CHF กำลังเคลื่อนที่ในลักษณะ Sideways
ตารางของ Forex
เวอร์ชั่นแบบ หน้าเว็บไซต์

Your IP address shows that you are currently located in the USA. If you are a resident of the United States, you are prohibited from using the services of InstaFintech Group including online trading, online transfers, deposit/withdrawal of funds, etc.
If you think you are seeing this message by mistake and your location is not the US, kindly proceed to the website. Otherwise, you must leave the website in order to comply with government restrictions.
Why does your IP address show your location as the USA?
Please confirm whether you are a US resident or not by clicking the relevant button below. If you choose the wrong option, being a US resident, you will not be able to open an account with InstaTrade anyway.
We are sorry for any inconvenience caused by this message.

