Vea también

 15.01.2024 09:02 AM
Trend analysis (Fig. 1).
The EUR/USD currency pair may move upward from the level of 1.0949 (closing of Friday's daily candlestick) to 1.0980, the 38.2% pullback level (yellow dotted line). From this level, a continued upward movement is possible to the upper fractal at 1.1000 (daily candle from 11/01/2024). In the case of testing this level, the price may move down.
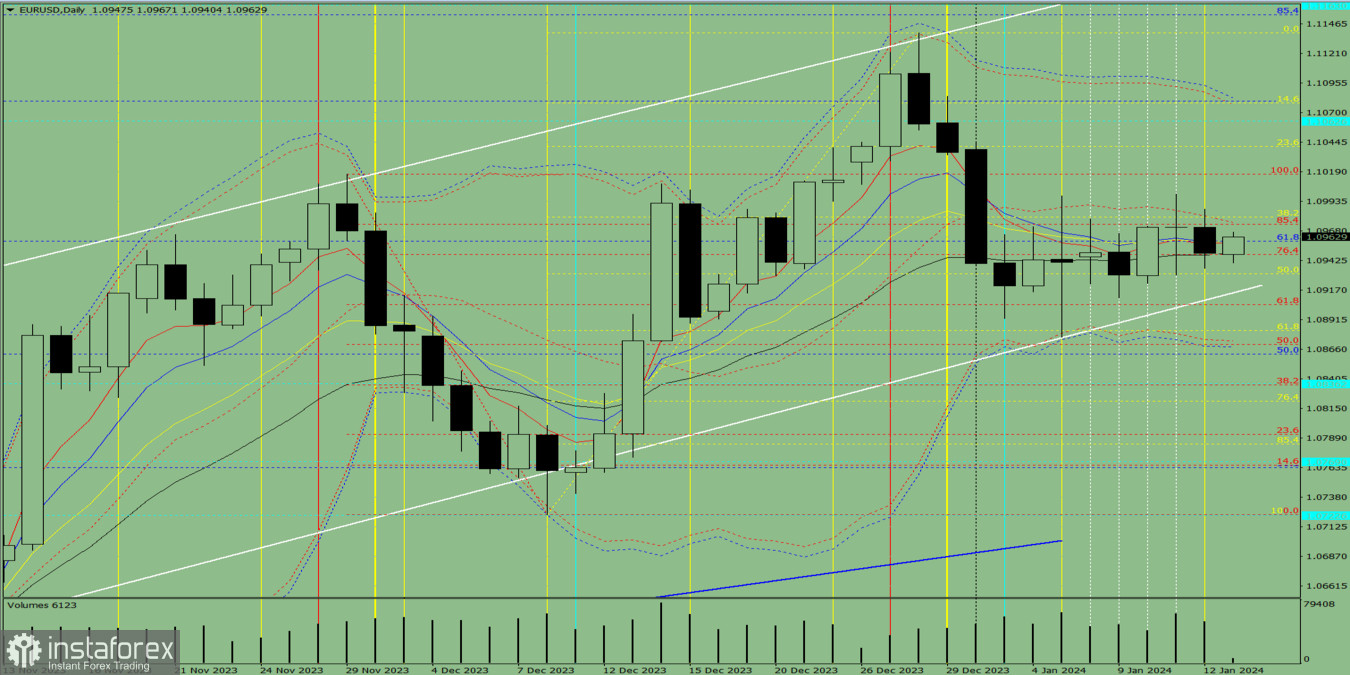
Fig. 1 (daily chart).
Comprehensive analysis:
Today, the price may move upward from the level of 1.0949 (closing of Friday's daily candlestick) to 1.0980, the 38.2% pullback level (yellow dotted line). From this level, a continued upward movement is possible to the upper fractal at 1.1000 (daily candle from 11/01/2024). In the case of testing this level, the price may move down.
Alternatively, the price may move upward from the level of 1.0949 (closing of Friday's daily candlestick) to 1.0980, the 38.2% pullback level (yellow dotted line). From this level, a downward movement is possible with a target of 1.0959, the 61.8% pullback level (blue dotted line).
You have already liked this post today
*El análisis de mercado publicado aquí tiene la finalidad de incrementar su conocimiento, más no darle instrucciones para realizar una operación.


