Актуальные паттерны

Паттерны – это графические модели, которые "рисует" цена на графике. Один из постулатов технического анализа говорит нам о том, что история (движение цены) всегда повторяется. Это значит, что в похожих ситуациях движение цены, зачастую, будет похожим, что позволяет с высокой долей вероятности спрогнозировать дальнейшее развитие ситуации.
Актуальные паттерны от ИнстаФорекс – это удобный сервис, который позволит вам всегда быть в курсе последних изменений на рынке и вовремя реагировать на появившиеся подсказки от рынка. В нашем сервисе вы всегда найдете самые свежие и актуальные паттерны на любой паре и на любом таймфрейме.
Прямоугольник
сформирован 06.04 в 23:00:12 (UTC+0)
сила сигнала 2 из 5
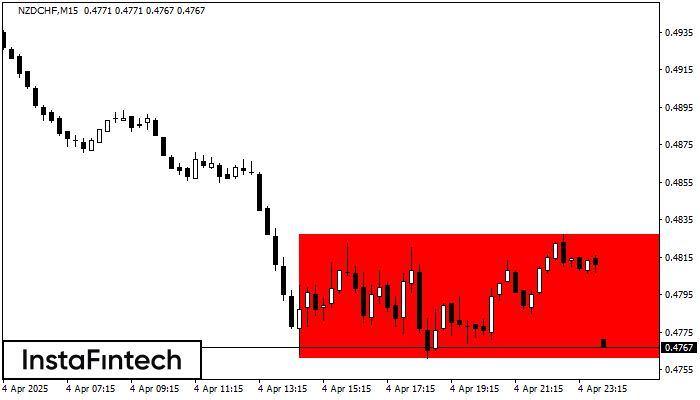
Сформирована фигура «Прямоугольник» на графике NZDCHF M15. Тип фигуры: Продолжение тренда; Границы: Верхняя 0.4827, Нижняя 0.4761; Сигнал: позиция на продажу открывается после фиксации цены ниже границы прямоугольника 0.4761.
Таймфреймы М5 и М15 могут иметь больше ложных точек входа.
Смотрите также
- Все
- Все
- Bearish Rectangle
- Bearish Symmetrical Triangle
- Bearish Symmetrical Triangle
- Bullish Rectangle
- Double Top
- Double Top
- Triple Bottom
- Triple Bottom
- Triple Top
- Triple Top
- Все
- Все
- Покупка
- Продажа
- Все
- 1
- 2
- 3
- 4
- 5
Triple Bottom
was formed on 24.04 at 08:30:33 (UTC+0)
signal strength 3 of 5
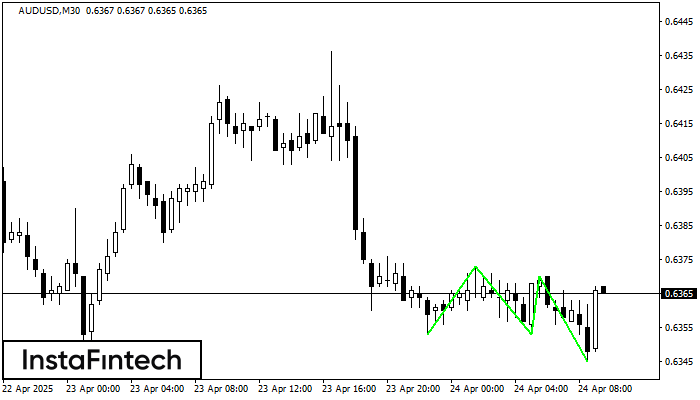
The Triple Bottom pattern has formed on the chart of AUDUSD M30. Features of the pattern: The lower line of the pattern has coordinates 0.6373 with the upper limit 0.6373/0.6370
Open chart in a new window
Double Bottom
was formed on 24.04 at 08:30:24 (UTC+0)
signal strength 3 of 5
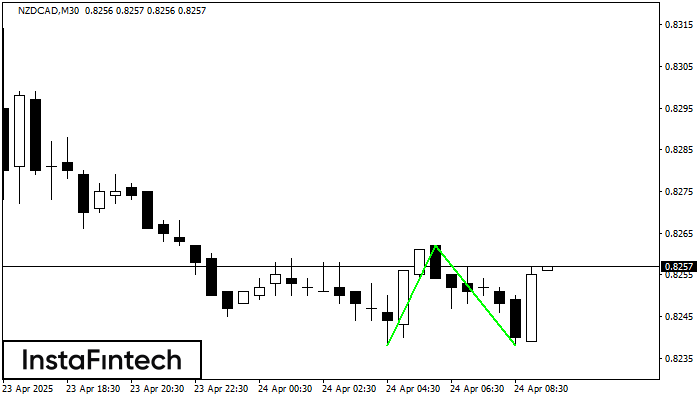
The Double Bottom pattern has been formed on NZDCAD M30. This formation signals a reversal of the trend from downwards to upwards. The signal is that a buy trade should
Open chart in a new window
Triple Bottom
was formed on 24.04 at 08:30:23 (UTC+0)
signal strength 2 of 5
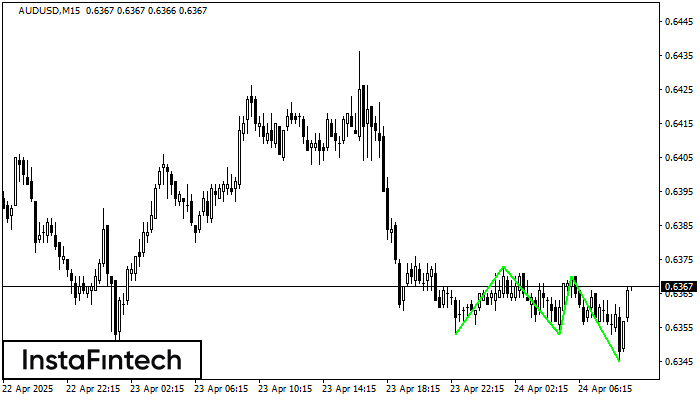
The Triple Bottom pattern has been formed on AUDUSD M15. It has the following characteristics: resistance level 0.6373/0.6370; support level 0.6353/0.6345; the width is 20 points. In the event
The M5 and M15 time frames may have more false entry points.
Open chart in a new window