Padrões atuais

Padrões são modelos gráficos que são formados no gráfico pelo preço. Segundo um dos postulados da análise técnica, a história (movimento de preços) se repete. Isso significa que os movimentos de preços geralmente são semelhantes nas mesmas situações, o que possibilita prever o desenvolvimento futuro da situação com alta probabilidade.
Os padrões relevantes da InstaTrade são um serviço fácil de usar, que permite que você esteja ciente das últimas mudanças no mercado e reaja a indícios do mercado a tempo. Em nosso serviço, você sempre encontrará os padrões mais recentes e relevantes em qualquer par e em qualquer período gráfico.
Triple Top
was formed on 01.04 at 18:30:11 (UTC+0)
signal strength 1 of 5
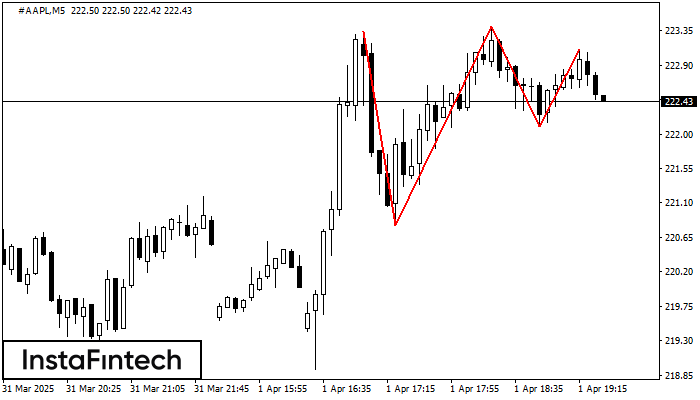
The Triple Top pattern has formed on the chart of the #AAPL M5. Features of the pattern: borders have an ascending angle; the lower line of the pattern has the coordinates 220.81/222.10 with the upper limit 223.34/223.11; the projection of the width is 253 points. The formation of the Triple Top figure most likely indicates a change in the trend from upward to downward. This means that in the event of a breakdown of the support level of 220.81, the price is most likely to continue the downward movement.
The M5 and M15 time frames may have more false entry points.
Veja também
- All
- All
- Bearish Rectangle
- Bearish Symmetrical Triangle
- Bearish Symmetrical Triangle
- Bullish Rectangle
- Double Top
- Double Top
- Triple Bottom
- Triple Bottom
- Triple Top
- Triple Top
- All
- All
- Buy
- Sale
- All
- 1
- 2
- 3
- 4
- 5
Cabeça & Ombros
was formed on 17.04 at 11:25:05 (UTC+0)
signal strength 1 of 5

Os GBPAUD M5 formaram o padrão Cabeça & Ombros com as seguintes características: O topo da cabeça está em 2.0878, a linha do pescoço e o ângulo para cima estão
Os intervalos M5 e M15 podem ter mais pontos de entrada falsos.
Open chart in a new window
Retângulo de baixa
was formed on 17.04 at 11:10:15 (UTC+0)
signal strength 1 of 5

De acordo com o gráfico de M5, GOLD formou Retângulo de baixa que é um padrão de uma continuação de tendência. O padrão está dentro dos seguintes limites: limite inferior
Os intervalos M5 e M15 podem ter mais pontos de entrada falsos.
Open chart in a new window
Fundo duplo
was formed on 17.04 at 11:00:16 (UTC+0)
signal strength 3 of 5

O padrão Fundo duplo foi formado em NZDCAD M30. Características: o nível de suporte 0.8188; o nível de resistência 0.8232; a largura do padrão 44 pontos. Se o nível
Open chart in a new window