Veja também


 07.04.2025 06:59 PM
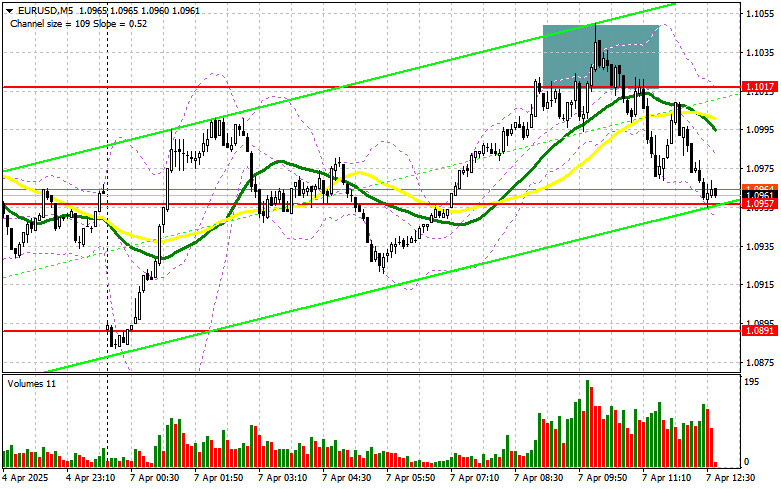
In my morning forecast, I highlighted the level of 1.1017 and planned to base entry decisions on it. Let's look at the 5-minute chart and see what happened. A rise and the formation of a false breakout at that level provided a good entry point for short positions, resulting in a 50-point drop in the euro. The technical outlook has been revised for the second half of the day.
To Open Long Positions on EUR/USD:
Market volatility remains elevated, which could negatively affect buyers of risk assets, including the euro. The chart clearly shows that any attempt by buyers to regain control leads to sharp sell-offs in the euro, so long positions should be approached with caution.
In the second half of the day, we await U.S. consumer credit data and a speech by FOMC member Adriana D. Kugler. Lately, Fed officials' remarks have been supportive of the dollar, as nearly all policymakers emphasize the need to maintain a pause in the rate-cutting cycle.
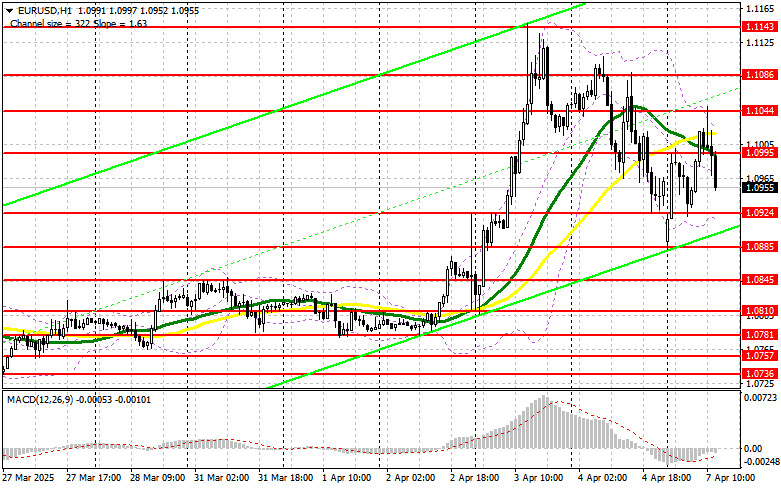
If the euro falls following the reports and comments, a false breakout around the 1.0924 support level will be a reason to buy EUR/USD in anticipation of a return to a bullish trend with a target of 1.0995. A breakout and successful retest of this range will confirm a proper entry point for further buying, aiming for 1.1044. The most distant target will be the 1.1086 area, where I plan to take profits.
If EUR/USD declines and there is no bullish activity near 1.0924, euro pressure will increase significantly. In that case, sellers may drive the pair to 1.0885. Only after a false breakout at that level will I consider entering long positions. I also plan to open longs on a rebound from 1.0845 with an intraday correction target of 30–35 points.
To Open Short Positions on EUR/USD:
Sellers are consistently active during euro rallies. Add global trade tariff uncertainty to the mix, and appetite for risk assets weakens further.
If U.S. data triggers a negative market reaction, a false breakout at the 1.0995 resistance area (formed in the first half of the day) will be sufficient to enter short positions, targeting the 1.0924 support. A breakout and consolidation below this range will serve as a strong sell signal, pushing the pair toward 1.0885. The ultimate target will be 1.0810, where I will take profit.
If EUR/USD moves higher again in the second half of the day and bears remain inactive near 1.0995, buyers may push the pair further up. In that case, I will postpone shorts until a test of the next resistance at 1.1044. I will sell there only after a failed breakout. If there's no downward movement from that level, I will look for shorts on a rebound from 1.1086, targeting a 30–35 point intraday correction.
The COT (Commitment of Traders) report for March 25 showed a slight increase in long positions and a notable reduction in shorts. While there isn't a surge in euro buyers, sellers continue to flee the market. Based on recent eurozone inflation data and ECB officials' statements, it's likely the regulator will leave policy unchanged at its upcoming April meeting, which could offer temporary support to the euro.
However, much depends on how significantly U.S. tariffs impact other countries. The greater the threat of a global economic slowdown, the more pressure there will be on risk assets, including the euro.
According to the COT report, long non-commercial positions rose by 844 to 189,796 and short non-commercial positions decreased by 5,256 to 124,271. The gap between long and short positions increased by 3,855.
Indicator Signals:
Moving Averages Trading is occurring near the 30- and 50-day moving averages, indicating market uncertainty.Note: The author uses H1 (hourly) chart data, which may differ from traditional daily (D1) moving average definitions.
Bollinger Bands In the event of a decline, the lower boundary of the indicator near 1.1000 will act as support.
Indicator Descriptions:
You have already liked this post today
*A análise de mercado aqui postada destina-se a aumentar o seu conhecimento, mas não dar instruções para fazer uma negociação.
Na minha previsão matinal, concentrei-me no nível 1,1358 e planejei tomar decisões de negociação com base nele. Vamos dar uma olhada no gráfico de 5 minutos para entender
Análise das operações de segunda-feira Gráfico 1H do EUR/USD O par EUR/USD iniciou a segunda-feira com uma forte recuperação. Durante a madrugada, o euro avançou entre 100 e 120 pips
Análise das operações de quinta-feira Gráfico 1H do GBP/USD Nas últimas 24 horas, o par GBP/USD avançou 170 pips, e a valorização da libra esterlina continuou durante a madrugada desta
Análise das operações de sexta-feira Gráfico 1H do GBP/USD O par GBP/USD registrou uma forte correção na sexta-feira, um movimento difícil de justificar — mesmo com a vantagem da retrospectiva
Análise das operações de sexta-feira Gráfico 1H de EUR/USD O par EUR/USD permaneceu sob forte instabilidade nesta sexta-feira. Desta vez, o movimento de baixa predominou — mas isso não tornou
Na minha previsão matinal, destaquei o nível 1,0994 e planejei basear minhas decisões de entrada no mercado nele. Vamos dar uma olhada no gráfico de 5 minutos e analisar
O par GBP/USD também registrou um forte movimento de alta na quinta-feira, impulsionado por um único fator. No final da noite de quarta-feira, Donald Trump anunciou a imposição de novas
Na minha previsão matinal, destaquei o nível 1,3098 como referência para decisões de entrada. Agora, vamos analisar o gráfico de 5 minutos para entender o que ocorreu. Após um declínio
Na minha previsão da manhã, destaquei o nível 1,0815 e planejei tomar decisões de entrada no mercado com base nele. Vamos dar uma olhada no gráfico de 5 minutos
Na minha previsão desta manhã, destaquei o nível de 1,2926 como um ponto-chave para decisões de negociação. Agora, vamos analisar o gráfico de 5 minutos e ver o que aconteceu
InstaForex em números

Your IP address shows that you are currently located in the USA. If you are a resident of the United States, you are prohibited from using the services of InstaFintech Group including online trading, online transfers, deposit/withdrawal of funds, etc.
If you think you are seeing this message by mistake and your location is not the US, kindly proceed to the website. Otherwise, you must leave the website in order to comply with government restrictions.
Why does your IP address show your location as the USA?
Please confirm whether you are a US resident or not by clicking the relevant button below. If you choose the wrong option, being a US resident, you will not be able to open an account with InstaTrade anyway.
We are sorry for any inconvenience caused by this message.


