Veja também


The EUR/USD currency pair pulled back slightly on Thursday following Wednesday evening's decline. In our previous article, we refrained from analyzing the Federal Reserve's meeting results and emphasized the need to wait at least a day to evaluate them with a clear head and observe the market's complete reaction. As of now, conclusions can be drawn.
The first conclusion is evident to all market participants: the meeting was entirely hawkish. The second conclusion, clear to us, is that such an outcome was entirely predictable. Since the beginning of the year, we have consistently stated that the market overestimated the Fed's ability and willingness to ease monetary policy. As of September 2024, the market had already priced in the entire cycle of policy easing in advance—and overshot, ignoring the simultaneous rate cuts in the Eurozone. We warned that following September 18, the euro might start declining. Since then, the euro has lost approximately 750 pips; we believe this decline is not over.
Looking at the weekly timeframe, the pair has the potential to fall to the 0.9500 level or even lower. Yesterday's Fed meeting again confirmed the theses and assumptions we have discussed for months. The U.S. economy remains robust, showing no signs of recession. The Fed officially revised its GDP forecasts for 2025-2026 upward. Additionally, via the "dot-plot," the monetary committee indicated it might lower the key rate twice next year by 0.25% each. Some Fed officials even believe that a single rate cut would suffice. This means that from the peak rate of 5.5%, it might decrease to 4% in 2025. The concept of a neutral rate level is not relevant in the near term. If the Fed cuts rates twice next year, it will cumulatively reduce them by 1.5%, a level the market had initially expected for 2024 and priced in accordingly. We believe that the longer time passes, the more factors will emerge that favor dollar strength.
Recall that last week, the European Central Bank lowered its key rates and convincingly indicated it has no intention of pausing rate cuts. Some ECB officials believe the rate could be reduced to zero. Many are concerned about the weak economic growth in the Eurozone, even though fostering growth is not the ECB's direct mandate. Nevertheless, another conclusion is as clear as the previous ones: the Fed will likely cut rates only a few times in 2025, while the ECB, whose rates remain significantly lower, may continue easing policy at every meeting.
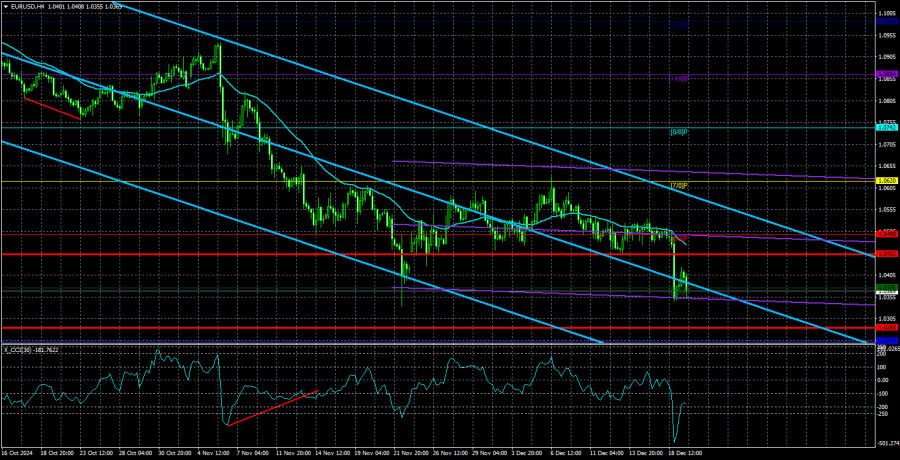
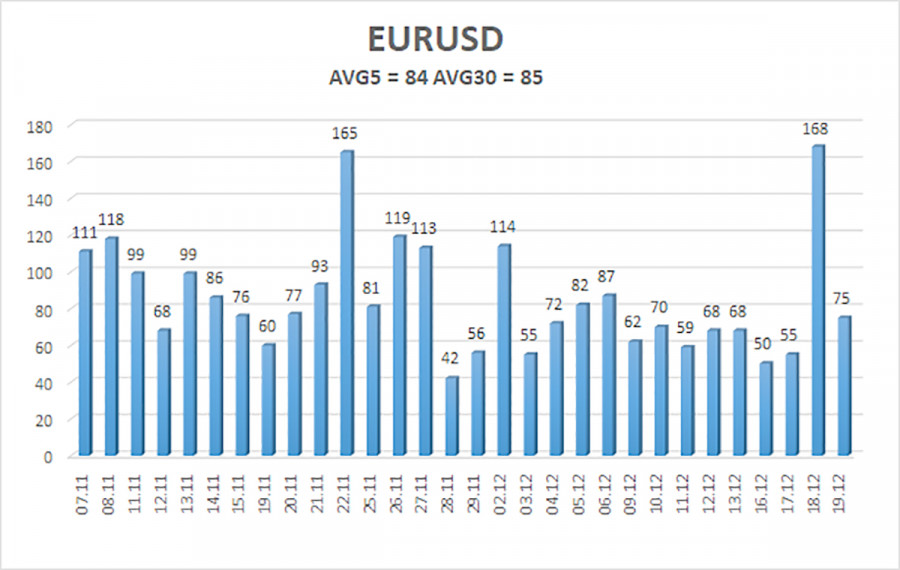
The average volatility of the EUR/USD currency pair over the last five trading days as of December 20 is 84 pips, characterized as "average." We expect the pair to move between the levels of 1.0285 and 1.0453 on Friday. The higher linear regression channel is directed downward, indicating that the global downtrend persists. The CCI indicator has once again entered the oversold zone amid a significant decline, which signals, at most, a potential correction.
Closest support levels:
Closest resistance levels:
The EUR/USD pair could resume its downtrend at any moment. In recent months, we have consistently maintained that the euro will likely decline in the medium term, fully supporting the overall downward trend. The likelihood that the market has priced in all future Federal Reserve rate cuts with a margin is high. As such, the dollar still has no substantial reasons for a medium-term decline, even though those reasons were limited previously. Short positions remain relevant with targets at 1.0285 and 1.0254 as long as the price remains below the moving average.
For those trading on "pure" technical analysis, long positions can be considered if the price rises above the moving average, targeting 1.0620. However, we do not currently recommend long positions to anyone.
Linear Regression Channels help determine the current trend. If both channels are aligned, it indicates a strong trend.
Moving Average Line (settings: 20,0, smoothed) defines the short-term trend and guides the trading direction.
Murray Levels act as target levels for movements and corrections.
Volatility Levels (red lines) represent the likely price range for the pair over the next 24 hours based on current volatility readings.
CCI Indicator: If it enters the oversold region (below -250) or overbought region (above +250), it signals an impending trend reversal in the opposite direction.
You have already liked this post today
*A análise de mercado aqui postada destina-se a aumentar o seu conhecimento, mas não dar instruções para fazer uma negociação.


InstaForex em números

Your IP address shows that you are currently located in the USA. If you are a resident of the United States, you are prohibited from using the services of InstaFintech Group including online trading, online transfers, deposit/withdrawal of funds, etc.
If you think you are seeing this message by mistake and your location is not the US, kindly proceed to the website. Otherwise, you must leave the website in order to comply with government restrictions.
Why does your IP address show your location as the USA?
Please confirm whether you are a US resident or not by clicking the relevant button below. If you choose the wrong option, being a US resident, you will not be able to open an account with InstaTrade anyway.
We are sorry for any inconvenience caused by this message.


