Veja também

 02.10.2024 03:55 PM
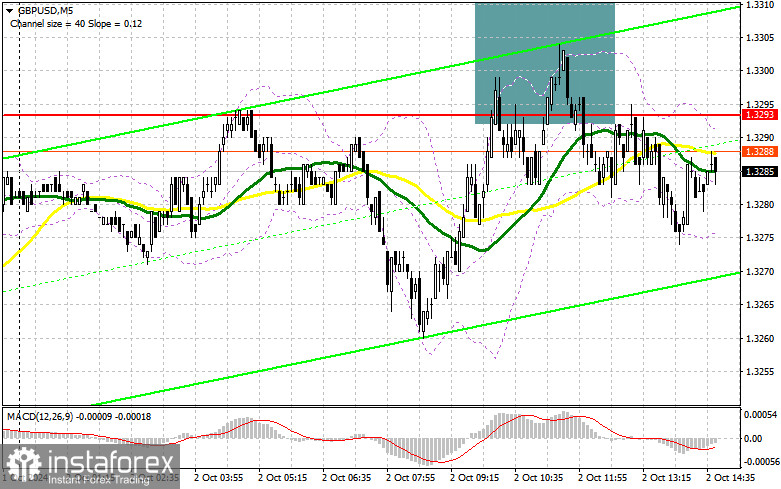
In my morning forecast, I focused on the level of 1.3293 and planned to make market entry decisions based on it. Let's look at the 5-minute chart and see what happened. The rise and subsequent formation of a false breakout provided an excellent entry point for selling the pound. This led to a 20-point drop before the pressure eased. The technical picture has been revised for the second half of the day.
To open long positions on GBP/USD:
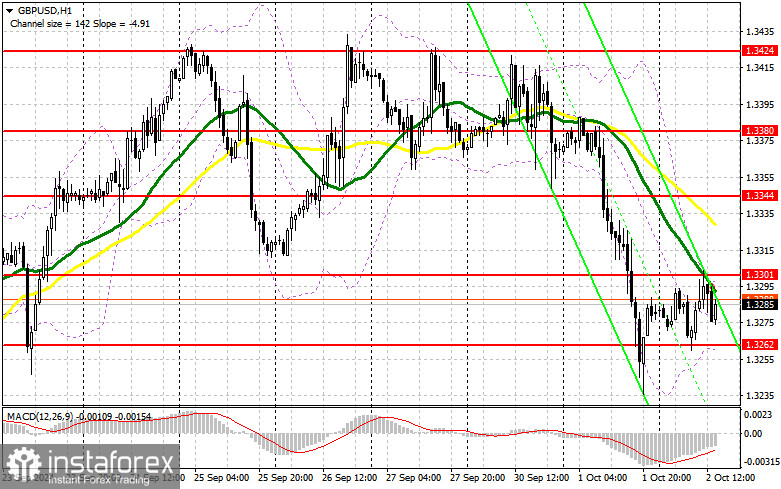
Considering the upcoming ADP employment data from the U.S., which could potentially disappoint, there are chances for a rise in the pound. Attention should also be paid to the interviews with FOMC members Michelle Bowman and Thomas Barkin. If the market withstands all this pressure, the pound may recover, something it couldn't achieve earlier in the day. I plan to act on a decline near the new support at 1.3262. A false breakout there offers a chance for a slight rise in the pair, leading to a recovery toward 1.3301, the resistance formed earlier in the day. A breakout and retest of this range from the top will strengthen the chances of developing an upward trend, triggering stop-loss orders for sellers and creating a good entry point for long positions, with a target of 1.3344, just below the moving averages. The final target will be the 1.3380 level, where I plan to take profits. If GBP/USD continues to decline and there's no bull activity near 1.3262 in the second half of the day, considering the ongoing geopolitical tensions, the pressure on the pair will increase. This could lead to a decline, followed by a retest of the 1.3222 support. Only a false breakout at that level will provide a valid signal for opening long positions. I plan to buy GBP/USD on a rebound from the 1.3190 low, targeting a 30-35 point upward correction within the day.
To open short positions on GBP/USD:
Sellers are showing some presence but without much aggression. The bears' task is to defend the new resistance at 1.3301. A test of this level after the release of U.S. statistics, along with a false breakout, will be an ideal entry point for selling the pound, targeting a further decline to the intermediate support at 1.3262. A breakout and retest of this range from below will hit the buyers' positions, triggering stop-loss orders and opening the path to 1.3222. The final target will be the 1.3190 level, where I will take profits. A test of this level could indicate the potential end of the pound's upward trend. If GBP/USD rises and there is no bear activity at 1.3301 in the second half of the day, buyers will try to recover some of yesterday's losses. The bears will then have no choice but to retreat to the resistance area at 1.3344, below which the moving averages favor the sellers. I will only sell there after a false breakout. If there is no downward movement there, I will look for short positions on a rebound near 1.3380, targeting a 30-35 point intraday downward correction.
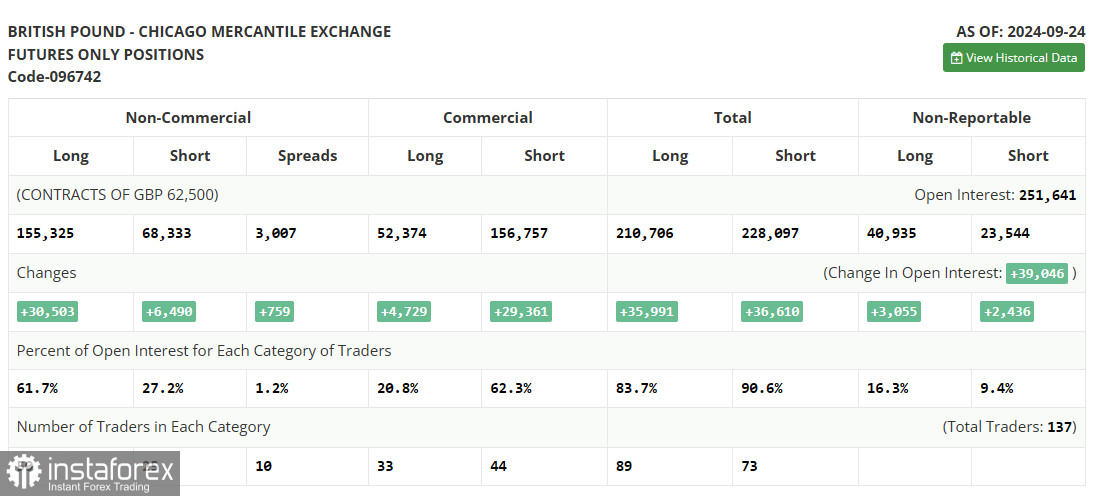
In the COT (Commitment of Traders) report for September 24, both short and long positions increased. It's clear that after the Bank of England decided to leave monetary policy unchanged and the Federal Reserve cut interest rates, more and more buyers are entering the market for the pound. The likelihood that the U.S. central bank will continue with a dovish policy only fuels the buying of risk assets, pushing traders away from the U.S. dollar. Comments from Bank of England representatives, stating that the economy is strong and performing well, also attract new traders betting on the medium-term strengthening of the pound. The latest COT report showed that long non-commercial positions increased by 30,503 to a level of 155,325, while short non-commercial positions increased by 6,490 to a level of 68,333. As a result, the gap between long and short positions increased by 759.
Indicator Signals:
Moving Averages:
Trading is taking place below the 30 and 50-day moving averages, indicating a decline in the pound.
Note: The periods and prices of the moving averages are considered on the hourly H1 chart by the author and differ from the classical daily moving averages on the D1 chart.
Bollinger Bands:
In case of a decline, the lower boundary of the indicator around 1.3262 will act as support.
Indicator Descriptions:
You have already liked this post today
*A análise de mercado aqui postada destina-se a aumentar o seu conhecimento, mas não dar instruções para fazer uma negociação.


