اصل پیٹرن یعنی ایکچوئل پیٹرن

پیٹرن تصویری صورت یعنی گرافکل ماڈلز ہوتے ہیں جو کہ چارٹ میں قیمت کی جانب سے بنتے ہیں جو کہ ٹیکنیکل تجزیات کے امکانات ، ہسٹری {قیمت کے اتار چڑھاو} چونکہ قیمت اپنے آپ کو دہراتی ہے - جس کا مطلب یہ ہے کہ قیمت کا اتار چڑھا یعنی حرکت ایک جیسے حالات میں ہی عموما مختلف ہوتی ہے جو کہ اس بات کو ممکن بناتی ہے قیمت کے مزید رویہ کی پیشن گوئی کی جاسکے جس کا اُسی طرح ہونے کے امکانات خاصے واضح ہوتے ہیں
انسٹا فاریکس کی "ریلی وینٹ" پیٹرنز نامی سروس استعمال میں بہت ہی آسان ہے جو کہ آپ کو مارکیٹ میں ہونے والی تازہ ترین تبدیلیوں کے حوالے باخبر رکھتے ہیں اور مارکیٹ کے ملنے والے اشاروں پر بر وقت در عمل دینے کے قابل کرتے ہیں - ہماری سہولیات سے آپ ہمیشہ پائیں گے تازہ ترین اور سب سے ذیادہ کار آمد انداز یعنی ریلی وینٹ انداز دستیاب ہوں گے- جو کہ کسی بھی پئیر اور ٹائم فریم کے حوالے سے دستیاب ہوں گے
Inverse Head and Shoulder
was formed on 03.04 at 00:00:00 (UTC+0)
signal strength 4 of 5

According to the chart of H1, AUDUSD formed the Inverse Head and Shoulder pattern. The Head’s top is set at 0.6315 while the median line of the Neck is found at 0.6220/0.6291. The formation of the Inverse Head and Shoulder pattern evidently signals a reversal of the downward trend. In other words, in case the scenario comes true, the price of AUDUSD will go towards 0.6355
یہ بھی دیکھیں
- All
- All
- Bearish Rectangle
- Bearish Symmetrical Triangle
- Bearish Symmetrical Triangle
- Bullish Rectangle
- Double Top
- Double Top
- Triple Bottom
- Triple Bottom
- Triple Top
- Triple Top
- All
- All
- Buy
- Sale
- All
- 1
- 2
- 3
- 4
- 5
Bearish Symmetrical Triangle
was formed on 16.04 at 02:00:48 (UTC+0)
signal strength 1 of 5

According to the chart of M5, NZDJPY formed the Bearish Symmetrical Triangle pattern. Description: The lower border is 84.16/84.34 and upper border is 84.51/84.34. The pattern width is measured
The M5 and M15 time frames may have more false entry points.
Open chart in a new window
Bearish Rectangle
was formed on 16.04 at 01:07:48 (UTC+0)
signal strength 1 of 5
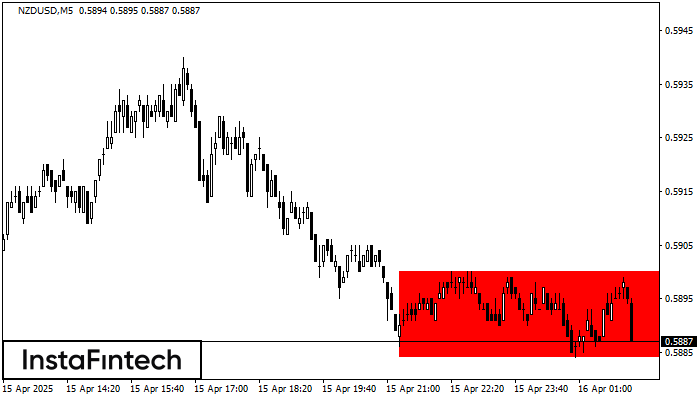
According to the chart of M5, NZDUSD formed the Bearish Rectangle. The pattern indicates a trend continuation. The upper border is 0.5900, the lower border is 0.5884. The signal means
The M5 and M15 time frames may have more false entry points.
Open chart in a new window
Double Top
was formed on 16.04 at 01:05:49 (UTC+0)
signal strength 1 of 5
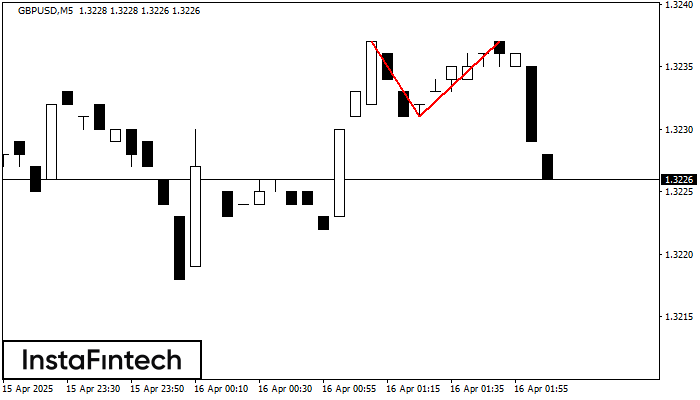
The Double Top reversal pattern has been formed on GBPUSD M5. Characteristics: the upper boundary 1.3237; the lower boundary 1.3231; the width of the pattern is 6 points. Sell trades
The M5 and M15 time frames may have more false entry points.
Open chart in a new window