یہ بھی دیکھیں

 22.02.2024 09:33 AM
Trend analysis (Fig. 1).
The EUR/USD currency pair may rise from the level of 1.0817 (closing of yesterday's daily candle) to the upper fractal at 1.0838 (blue dotted line). When this level is reached, the price may decline.
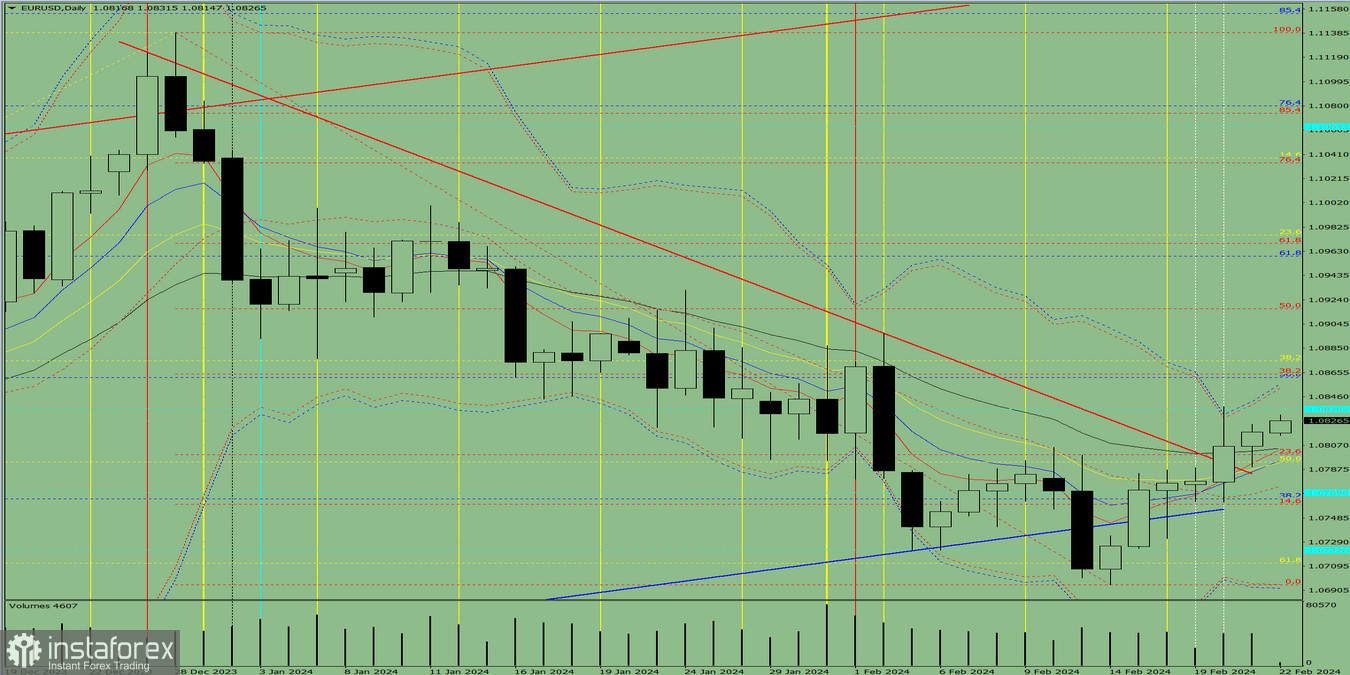
Fig. 1 (daily chart).
Comprehensive analysis:
General conclusion: Today, the price may rise from the level of 1.0817 (closing of yesterday's daily candle) to the upper fractal at 1.0838 (blue dotted line). When this level is reached, the price may decline.
Alternatively, from the level of 1.0817 (closing of yesterday's daily candle), the price may rise to the upper fractal at 1.0838 (blue dotted line). Upon reaching this level, a continued upward movement is possible with a target of 1.0864, the 38.2% pullback level (red dotted line).
You have already liked this post today
*تعینات کیا مراد ہے مارکیٹ کے تجزیات یہاں ارسال کیے جاتے ہیں جس کا مقصد آپ کی بیداری بڑھانا ہے، لیکن تجارت کرنے کے لئے ہدایات دینا نہیں.


