یہ بھی دیکھیں


 17.05.2023 12:15 AM
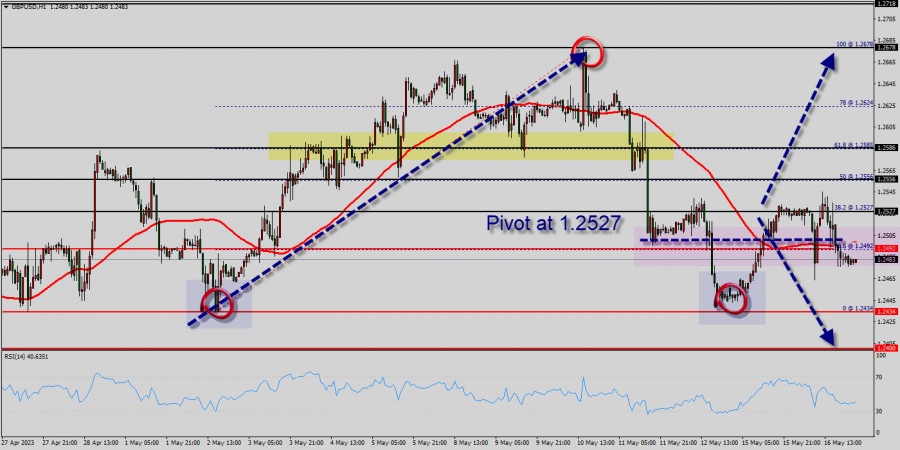
The GBP/USD pair traded higher and closed the day in the positive territory near the price of 1.2466. Right now, it was trading in a narrow range of 1.2466 staying close to a 3-days high. On the hourly chart, the GBP/USD pair is still trading above the MA (100) H1 moving average line (1.2461 - weekly pivot point). The situation is similar on the 4-hour chart. Based on the foregoing, it is probably worth sticking to the north direction in trading, and as long as the GBP/USD pair remains above MA 100 H1, it may be necessary to look for entry points to buy for the formation of a correction.
All elements being clearly bullish, it would be possible for traders to trade only long positions on the GBP/USD pair as long as the price remains well above the golden ratio of 1.2461. The buyers' bullish objective is set at 1.2583. The price is likely to form a double top in the same time frame. Accordingly, the GBP/USD pair is showing signs of strength following a breakout of the highest level of 1.2583. So, buy above the level of 1.2461 with the first target at 1.2583 in order to test the daily resistance 1. The level of 1.2583 is a good place to take profits. Moreover, the RSI is still signaling that the trend is upward as it remains strong above the moving average (100). This suggests that the pair will probably go up in coming hours. A bullish break in this resistance would boost the bullish momentum.
Pound Sterling is currently trading at 1.2466. If the trend reverses from this point, then a possible future share price target could be 1.2400. If the price of Pound Sterling is trading above 1.2583 then possibility of upside targets getting achieved is higher around the level of 1.2783. The basic bullish trend is very strong on the GBP/USD pair, but the short term shows some signs of running out of steam. Nevertheless, a purchase could be considered as long as the price remains above 1.2461.
Crossing the first resistance at 1.2583 would be a sign of a potential new surge in the price. Buyers would then use the next resistance located at 1.2583 as an objective. Crossing it would then enable buyers to target 1.2583. Caution, a return to below 1.2583 would be a sign of a consolidation phase in the short-term basic trend. If this is the case, remember that trading against the trend may be riskier. It would seem more appropriate to wait for a signal indicating reversal of the trend. In the very short term, the general bullish sentiment is not called into question, despite technical indicators being indecisive. All elements being clearly bullish market, it would be possible for traders to trade only long positions on the GBP/USD pair as long as the price remains well above the price of 1.2461.
A bullish break in this resistance would boost the bullish momentum. The buyers could then target the resistance located at 1.2583. This suggests that the pair will probably go up in coming hours. If the trend is able to break the level of 1.2583 (double top), then the market will call for a strong bullish market towards the objective of 1.2615 this week. It is also should be noted, beware of bullish excesses that could lead to a possible short-term correction; but this possible correction would not be tradeable. On the other hand, in case a reversal takes place and the GBP/USD pair breaks through the support level of 1.2432, a further decline to 1.2400 can occur. It would indicate a bearish market.
You have already liked this post today
*تعینات کیا مراد ہے مارکیٹ کے تجزیات یہاں ارسال کیے جاتے ہیں جس کا مقصد آپ کی بیداری بڑھانا ہے، لیکن تجارت کرنے کے لئے ہدایات دینا نہیں.
ایگل انڈیکیٹراوور باٹ سطح پر پہنچ رہا ہے، اس لیے ہم اس کی بلند ترین 3,245 سے نیچے فروخت کے مواقع تلاش کریں گے، جس کے اہداف 3,200، 3,170
آنے والے گھنٹوں کے لیے ہمارا تجارتی منصوبہ 3,224 سے نیچے سونا فروخت کرنا ہے، جس کا ہدف 3,203 اور 3,156 ہے۔ ہمیں کسی بھی تکنیکی بحالی کے لیے چوکنا
تعداد میں انسٹا فاریکس

Your IP address shows that you are currently located in the USA. If you are a resident of the United States, you are prohibited from using the services of InstaFintech Group including online trading, online transfers, deposit/withdrawal of funds, etc.
If you think you are seeing this message by mistake and your location is not the US, kindly proceed to the website. Otherwise, you must leave the website in order to comply with government restrictions.
Why does your IP address show your location as the USA?
Please confirm whether you are a US resident or not by clicking the relevant button below. If you choose the wrong option, being a US resident, you will not be able to open an account with InstaTrade anyway.
We are sorry for any inconvenience caused by this message.

