Actual patterns

Patterns are graphical models which are formed in the chart by the price. According to one of the technical analysis postulates, history (price movement) repeats itself. It means that the price movements are often similar in the same situations which makes it possible to predict the further development of the situation with a high probability.
Relevant patterns by InstaTrade is an easy-to-use service which allows you to be aware of latest changes in the market and react to clues from the market in time. In our service you will always find the latest and most relevant patterns on any pair and any timeframe.
Bearish pennant
was formed on 02.04 at 14:55:25 (UTC+0)
signal strength 1 of 5
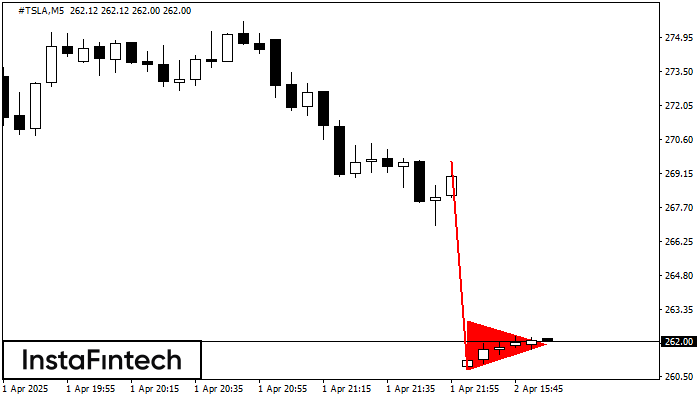
The Bearish pennant pattern has formed on the #TSLA M5 chart. It signals potential continuation of the existing trend. Specifications: the pattern’s bottom has the coordinate of 260.80; the projection of the flagpole height is equal to 887 pips. In case the price breaks out the pattern’s bottom of 260.80, the downtrend is expected to continue for further level 260.65.
The M5 and M15 time frames may have more false entry points.
See Also
- All
- All
- Bearish Rectangle
- Bearish Symmetrical Triangle
- Bearish Symmetrical Triangle
- Bullish Rectangle
- Double Top
- Double Top
- Triple Bottom
- Triple Bottom
- Triple Top
- Triple Top
- All
- All
- Buy
- Sale
- All
- 1
- 2
- 3
- 4
- 5
Banderín alcista
was formed on 09.04 at 00:45:35 (UTC+0)
signal strength 1 of 5
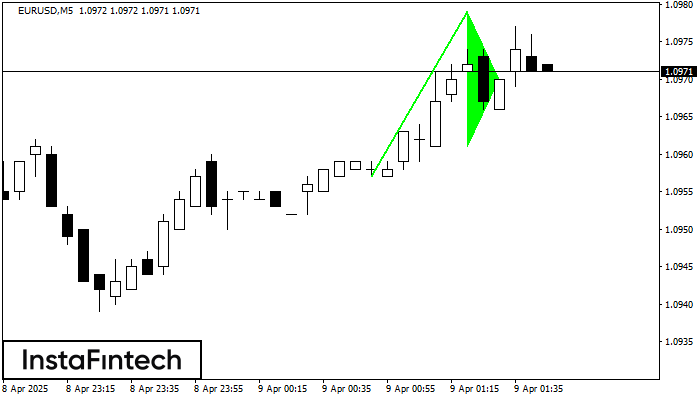
La señal Banderín alcista – Instrumento de negociación EURUSD M5, patrón de continuación. Pronóstico: es posible establecer una posición de compra por encima del alza del patrón de 1.0979
Los marcos de tiempo M5 y M15 pueden tener más puntos de entrada falsos.
Open chart in a new window
Bandera alcista
was formed on 09.04 at 00:35:19 (UTC+0)
signal strength 1 of 5
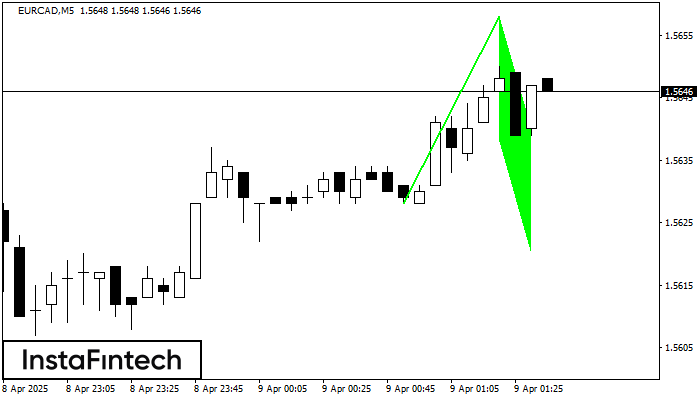
El patrón Bandera alcista que señala la continuación de una tendencia ha sido formado en el gráfico EURCAD M5. Pronóstico: si el precio rompe por encima del alza del patrón
Los marcos de tiempo M5 y M15 pueden tener más puntos de entrada falsos.
Open chart in a new window
Banderín alcista
was formed on 09.04 at 00:35:14 (UTC+0)
signal strength 1 of 5
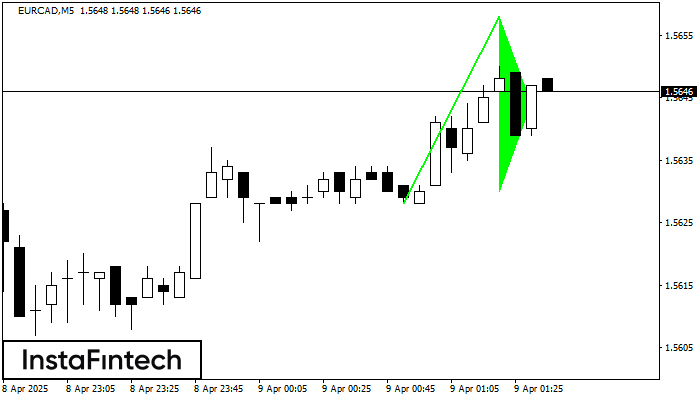
El patrón gráfico Banderín alcista se ha formado en el instrumento EURCAD M5. Este tipo de patrón entra en la categoría de patrones de continuación. En este caso
Los marcos de tiempo M5 y M15 pueden tener más puntos de entrada falsos.
Open chart in a new window