Долзарб паттернлар

Двойное дно
сформирован 15.04 в 21:15:37 (UTC+0)
сила сигнала 2 из 5
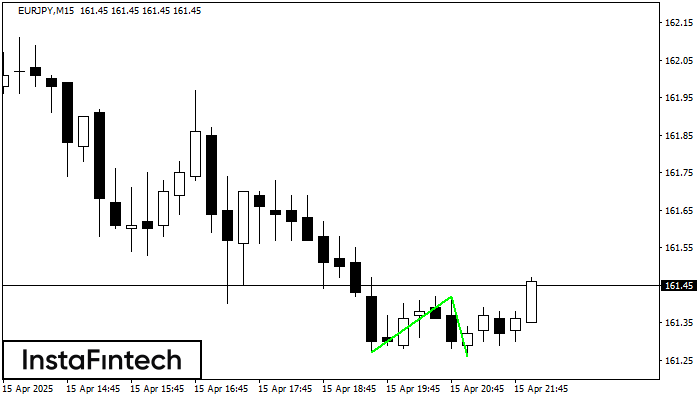
Сформирована фигура «Двойное дно» на графике EURJPY M15. Верхняя граница 161.42; Нижняя граница 161.26; Ширина фигуры 15 пунктов. В случае пробоя верхней границы 161.42 можно будет прогнозировать изменение тенденции, где ширина фигуры и будет являться расстоянием предположительного Тейк Профита.
Таймфреймы М5 и М15 могут иметь больше ложных точек входа.
- Все
- Все
- Bearish Rectangle
- Bearish Symmetrical Triangle
- Bearish Symmetrical Triangle
- Bullish Rectangle
- Double Top
- Double Top
- Triple Bottom
- Triple Bottom
- Triple Top
- Triple Top
- Все
- Все
- Покупка
- Продажа
- Все
- 1
- 2
- 3
- 4
- 5
Bullish Rectangle
was formed on 19.04 at 17:03:40 (UTC+0)
signal strength 1 of 5

According to the chart of M5, #Bitcoin formed the Bullish Rectangle. This type of a pattern indicates a trend continuation. It consists of two levels: resistance 85457.12 and support 85308.07
The M5 and M15 time frames may have more false entry points.
Open chart in a new window
Double Top
was formed on 19.04 at 16:44:37 (UTC+0)
signal strength 1 of 5

The Double Top reversal pattern has been formed on #Bitcoin M5. Characteristics: the upper boundary 85455.73; the lower boundary 85324.27; the width of the pattern is 13285 points. Sell trades
The M5 and M15 time frames may have more false entry points.
Open chart in a new window
Triple Top
was formed on 18.04 at 22:15:20 (UTC+0)
signal strength 2 of 5

The Triple Top pattern has formed on the chart of the EURUSD M15. Features of the pattern: borders have an ascending angle; the lower line of the pattern
The M5 and M15 time frames may have more false entry points.
Open chart in a new window