Долзарб паттернлар

Двойное дно
сформирован 02.04 в 14:31:58 (UTC+0)
сила сигнала 2 из 5
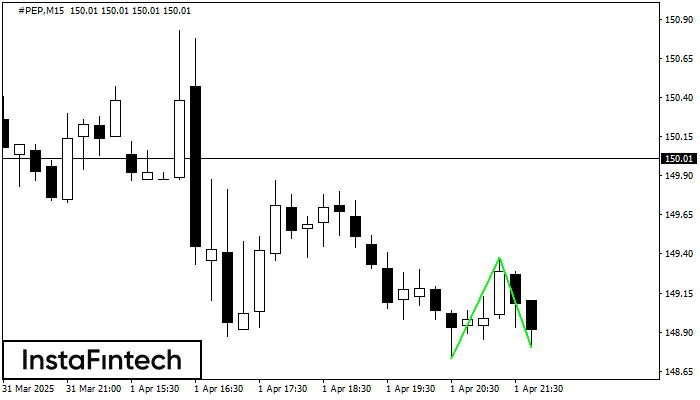
Сформирована фигура «Двойное дно» на графике #PEP M15. Верхняя граница 149.38; Нижняя граница 148.80; Ширина фигуры 65 пунктов. В случае пробоя верхней границы 149.38 можно будет прогнозировать изменение тенденции, где ширина фигуры и будет являться расстоянием предположительного Тейк Профита.
Таймфреймы М5 и М15 могут иметь больше ложных точек входа.
Шунингдек кўринг
- Все
- Все
- Bearish Rectangle
- Bearish Symmetrical Triangle
- Bearish Symmetrical Triangle
- Bullish Rectangle
- Double Top
- Double Top
- Triple Bottom
- Triple Bottom
- Triple Top
- Triple Top
- Все
- Все
- Покупка
- Продажа
- Все
- 1
- 2
- 3
- 4
- 5
Bullish Rectangle
was formed on 09.04 at 02:09:41 (UTC+0)
signal strength 3 of 5
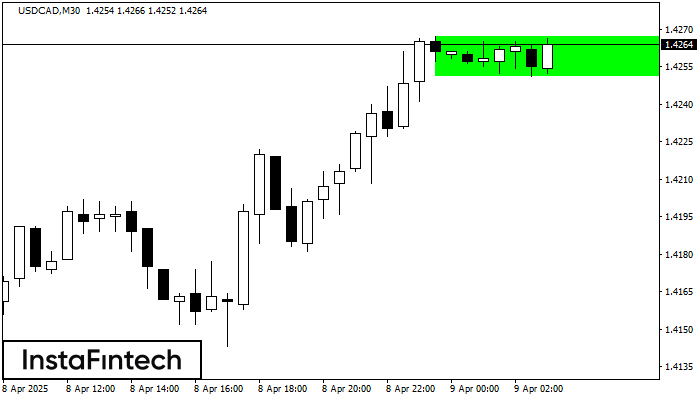
According to the chart of M30, USDCAD formed the Bullish Rectangle. The pattern indicates a trend continuation. The upper border is 1.4267, the lower border is 1.4251. The signal means
Open chart in a new window
Bearish Rectangle
was formed on 06.04 at 23:00:32 (UTC+0)
signal strength 3 of 5
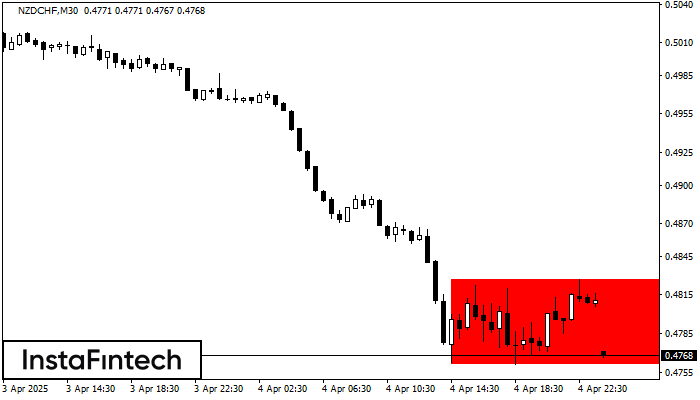
According to the chart of M30, NZDCHF formed the Bearish Rectangle. The pattern indicates a trend continuation. The upper border is 0.4827, the lower border is 0.4761. The signal means
Open chart in a new window
Bearish Rectangle
was formed on 04.04 at 19:12:06 (UTC+0)
signal strength 3 of 5
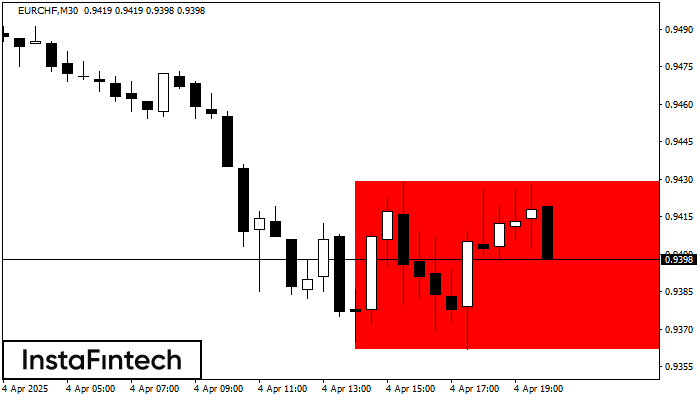
According to the chart of M30, EURCHF formed the Bearish Rectangle. This type of a pattern indicates a trend continuation. It consists of two levels: resistance 0.9429 - 0.0000
Open chart in a new window