Долзарб паттернлар

Прямоугольник
сформирован 02.04 в 04:46:22 (UTC+0)
сила сигнала 1 из 5
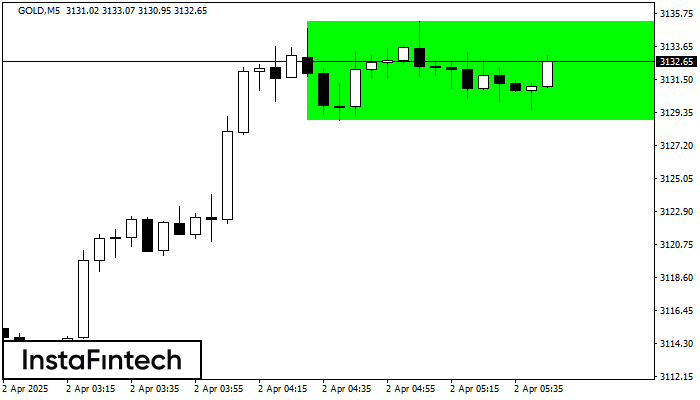
По торговому инструменту GOLD на M5 сформировалась фигура продолжения тренда - «Прямоугольник». Фигура имеет границы: Нижняя 3128.79; Верхняя 3135.25. В случае пробоя верхней границы вероятно дальнейшее движение в сторону тренда.
Таймфреймы М5 и М15 могут иметь больше ложных точек входа.
Шунингдек кўринг
- Все
- Все
- Bearish Rectangle
- Bearish Symmetrical Triangle
- Bearish Symmetrical Triangle
- Bullish Rectangle
- Double Top
- Double Top
- Triple Bottom
- Triple Bottom
- Triple Top
- Triple Top
- Все
- Все
- Покупка
- Продажа
- Все
- 1
- 2
- 3
- 4
- 5
Triple Top
was formed on 09.04 at 11:34:58 (UTC+0)
signal strength 1 of 5

On the chart of the NZDUSD M5 trading instrument, the Triple Top pattern that signals a trend change has formed. It is possible that after formation of the third peak
The M5 and M15 time frames may have more false entry points.
Open chart in a new window
Triple Bottom
was formed on 09.04 at 11:30:02 (UTC+0)
signal strength 3 of 5
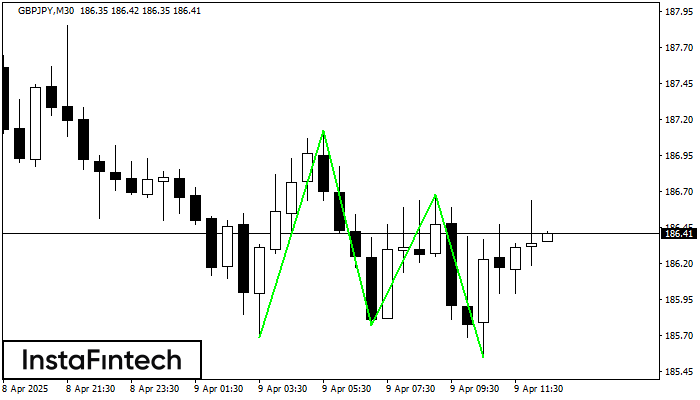
The Triple Bottom pattern has formed on the chart of GBPJPY M30. Features of the pattern: The lower line of the pattern has coordinates 187.12 with the upper limit 187.12/186.68
Open chart in a new window
Bullish Rectangle
was formed on 09.04 at 11:21:51 (UTC+0)
signal strength 1 of 5
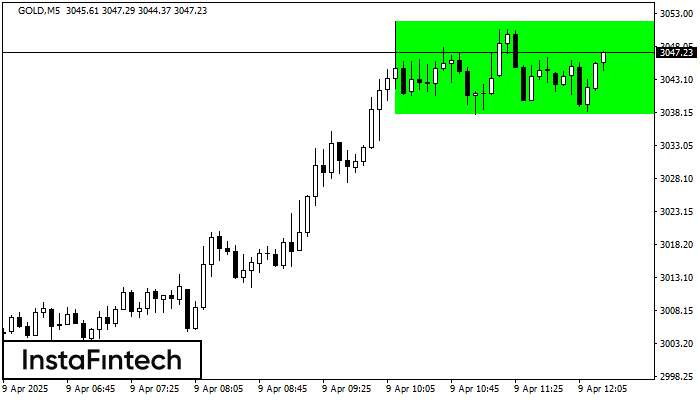
According to the chart of M5, GOLD formed the Bullish Rectangle. This type of a pattern indicates a trend continuation. It consists of two levels: resistance 3051.82 and support 3037.74
The M5 and M15 time frames may have more false entry points.
Open chart in a new window