

Долзарб паттернлар

Бычий вымпел
сформирован 02.04 в 01:43:27 (UTC+0)
сила сигнала 1 из 5
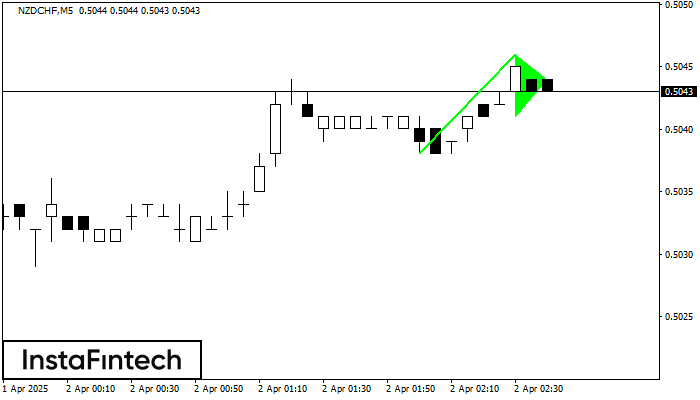
Графическая фигура «Бычий вымпел» сформировалась по инструменту NZDCHF на M5. Данный вид фигуры относится к типу продолжения тенденции. В случае если котировке удастся преодолеть максимум вымпела 0.5046, то ожидается продолжение восходящего тренда к уровню 0.5061.
Таймфреймы М5 и М15 могут иметь больше ложных точек входа.
- Все
- Все
- Bearish Rectangle
- Bearish Symmetrical Triangle
- Bearish Symmetrical Triangle
- Bullish Rectangle
- Double Top
- Double Top
- Triple Bottom
- Triple Bottom
- Triple Top
- Triple Top
- Все
- Все
- Покупка
- Продажа
- Все
- 1
- 2
- 3
- 4
- 5
Bearish Rectangle
was formed on 11.04 at 15:02:18 (UTC+0)
signal strength 3 of 5
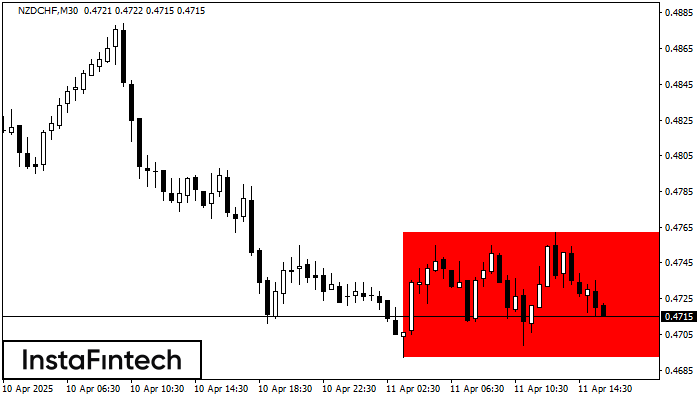
According to the chart of M30, NZDCHF formed the Bearish Rectangle. The pattern indicates a trend continuation. The upper border is 0.4762, the lower border is 0.4692. The signal means
Open chart in a new window
Bearish Rectangle
was formed on 11.04 at 14:48:14 (UTC+0)
signal strength 3 of 5
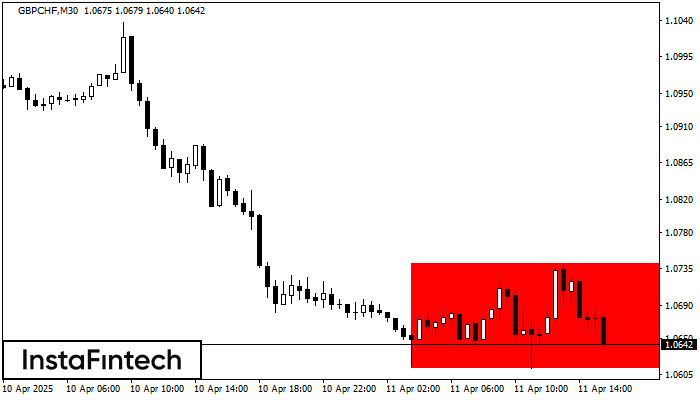
According to the chart of M30, GBPCHF formed the Bearish Rectangle which is a pattern of a trend continuation. The pattern is contained within the following borders: lower border 1.0613
Open chart in a new window
Bullish Rectangle
was formed on 10.04 at 14:30:16 (UTC+0)
signal strength 3 of 5
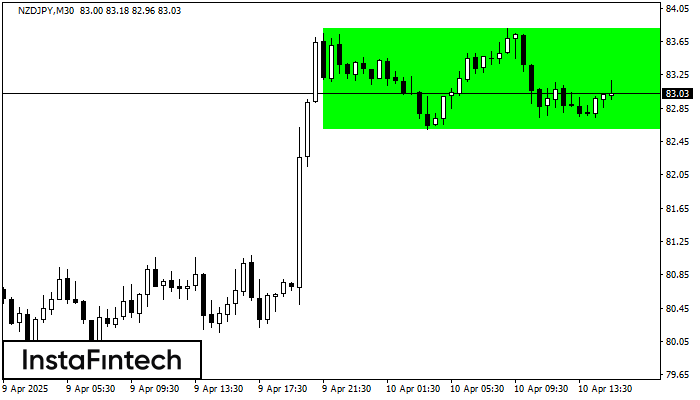
According to the chart of M30, NZDJPY formed the Bullish Rectangle. This type of a pattern indicates a trend continuation. It consists of two levels: resistance 83.80 and support 82.60
Open chart in a new window
