Corak sebenar

Bearish Rectangle
was formed on 03.04 at 21:49:49 (UTC+0)
signal strength 2 of 5
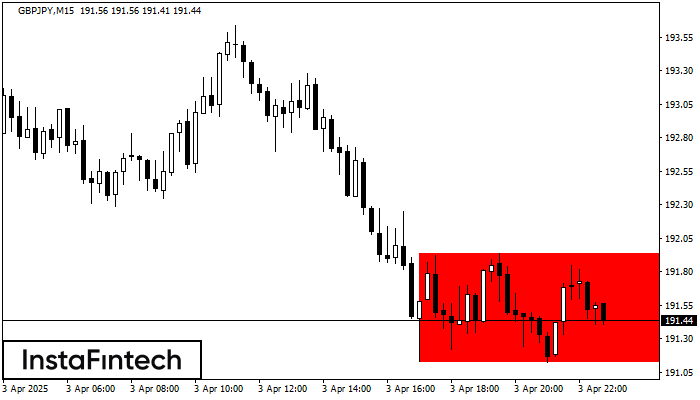
According to the chart of M15, GBPJPY formed the Bearish Rectangle. This type of a pattern indicates a trend continuation. It consists of two levels: resistance 191.94 - 0.00 and support 191.12 – 191.12. In case the resistance level 191.12 - 191.12 is broken, the instrument is likely to follow the bearish trend.
The M5 and M15 time frames may have more false entry points.
- All
- All
- Bearish Rectangle
- Bearish Symmetrical Triangle
- Bearish Symmetrical Triangle
- Bullish Rectangle
- Double Top
- Double Top
- Triple Bottom
- Triple Bottom
- Triple Top
- Triple Top
- All
- All
- Buy
- Sale
- All
- 1
- 2
- 3
- 4
- 5
Double Bottom
was formed on 21.04 at 21:10:25 (UTC+0)
signal strength 1 of 5
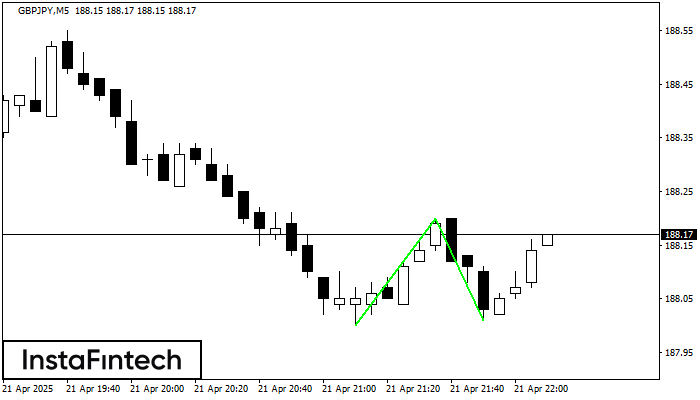
Corak Double Bottom telah dibentuk pada GBPJPY M5. Ciri-ciri: tahap sokongan 188.00; tahap rintangan 188.20; lebar corak 20 mata. Sekiranya tahap rintangan ditembusi, perubahan aliran boleh diramalkan dengan titik sasaran
Carta masa M5 dan M15 mungkin mempunyai lebih banyak titik kemasukan palsu.
Open chart in a new window
Double Top
was formed on 21.04 at 20:31:25 (UTC+0)
signal strength 1 of 5
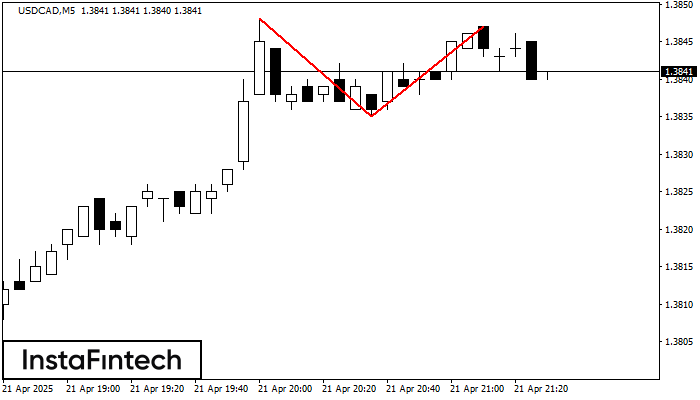
Corak Double Top telah dibentuk pada USDCAD M5. Isyarat bahawa aliran telah berubah dari aliran menaik ke aliran menurun. Mungkin, sekiranya asas corak 1.3835 ditembusi, pergerakan menurun akan berterusan
Carta masa M5 dan M15 mungkin mempunyai lebih banyak titik kemasukan palsu.
Open chart in a new window
Double Bottom
was formed on 21.04 at 20:30:22 (UTC+0)
signal strength 2 of 5
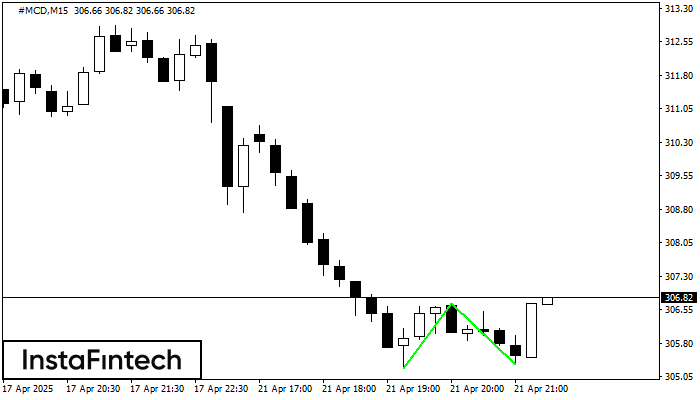
Corak Double Bottom telah dibentuk pada #MCD M15. Ciri-ciri: tahap sokongan 305.24; tahap rintangan 306.70; lebar corak 146 mata. Sekiranya tahap rintangan ditembusi, perubahan aliran boleh diramalkan dengan titik sasaran
Carta masa M5 dan M15 mungkin mempunyai lebih banyak titik kemasukan palsu.
Open chart in a new window