

Corak sebenar

Triple Top
was formed on 03.04 at 16:19:38 (UTC+0)
signal strength 1 of 5
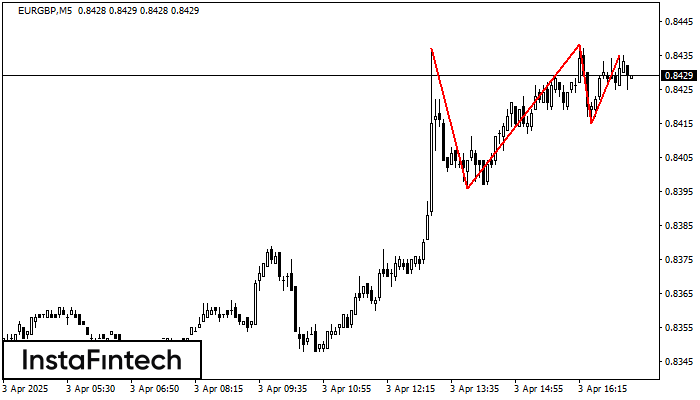
The Triple Top pattern has formed on the chart of the EURGBP M5. Features of the pattern: borders have an ascending angle; the lower line of the pattern has the coordinates 0.8396/0.8415 with the upper limit 0.8437/0.8435; the projection of the width is 41 points. The formation of the Triple Top figure most likely indicates a change in the trend from upward to downward. This means that in the event of a breakdown of the support level of 0.8396, the price is most likely to continue the downward movement.
The M5 and M15 time frames may have more false entry points.
Juga lihat
- All
- All
- Bearish Rectangle
- Bearish Symmetrical Triangle
- Bearish Symmetrical Triangle
- Bullish Rectangle
- Double Top
- Double Top
- Triple Bottom
- Triple Bottom
- Triple Top
- Triple Top
- All
- All
- Buy
- Sale
- All
- 1
- 2
- 3
- 4
- 5
Pennant Aliran Menaik
was formed on 21.04 at 07:00:12 (UTC+0)
signal strength 3 of 5

Corak grafik Pennant Aliran Menaik telah terbentuk pada instrumen NZDCAD M30. Jenis corak ini berada di bawah kategori corak kesinambungan. Dalam situasi ini, sekiranya penetapan harga boleh menembusi tinggi, adalah
Open chart in a new window
Segi Empat Menaik
was formed on 21.04 at 06:10:19 (UTC+0)
signal strength 1 of 5

Berdasarkan carta M5, #Bitcoin telah membentuk Segi Empat Menaik yang merupakan corak kesinambungan aliran. Corak adalah terkandung dalam sempadan berikut: sempadan bawah 87098.24 – 87098.24 dan sempadan atas 87617.56 –
Carta masa M5 dan M15 mungkin mempunyai lebih banyak titik kemasukan palsu.
Open chart in a new window
Double Bottom
was formed on 21.04 at 06:05:07 (UTC+0)
signal strength 1 of 5

Corak Double Bottom telah dibentuk pada USDJPY M5. Pembentukan ini menandakan pembalikan aliran dari aliran menurun ke atas. Isyarat ialah perdagangan membeli harus dibuka selepas sempadan atas corak 140.85 telah
Carta masa M5 dan M15 mungkin mempunyai lebih banyak titik kemasukan palsu.
Open chart in a new window


