Lihat juga


 31.03.2025 11:58 AM
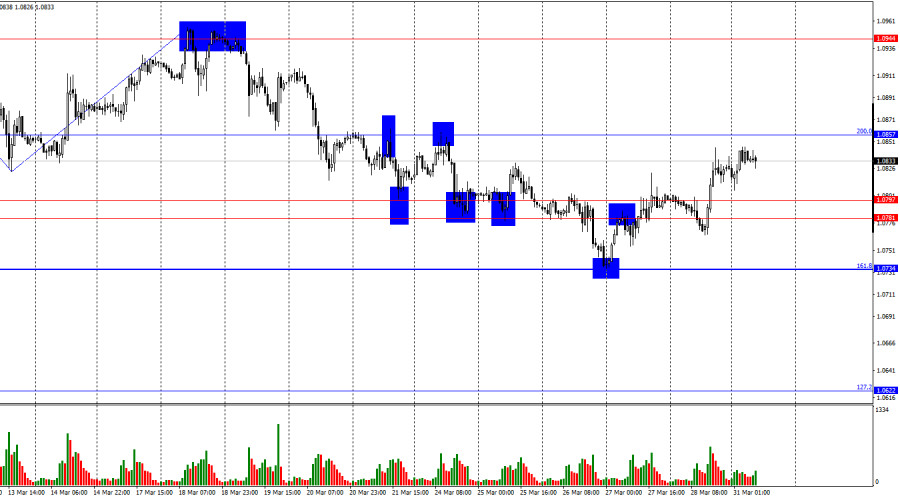
On Friday, the EUR/USD pair consolidated above the 1.0781–1.0797 zone, allowing the upward movement to continue toward the 200.0% Fibonacci level at 1.0857. A rebound from this level would favor the US dollar and lead to a slight decline toward the support zone at 1.0781–1.0797. A consolidation above 1.0857 would open the way for further growth toward the next level at 1.0944. Bulls are attacking again and are fully entitled to do so.
The wave situation on the hourly chart has changed. The last completed upward wave broke the previous peak by just a few points, while the last downward wave broke the previous low. This currently indicates a gradual trend reversal toward a bearish direction. However, Donald Trump introduced new tariffs last week, causing the bears to retreat once again. Trump is likely to introduce tariffs again this week, giving the bulls another opportunity to launch an offensive.
Friday's news background was interesting, but the events of Wednesday and Thursday were far more significant for traders. It was announced that Donald Trump had imposed tariffs on all car imports into the US, which enabled the bulls to launch a new offensive. After that event, other news had little weight in the eyes of traders. For example, a decent US GDP report for Q4 didn't help the dollar, and the euro didn't fall even after weak unemployment data from Germany. Thus, I fully agree with the majority of analysts who believe that the only reason for the US dollar's decline is Donald Trump. It's not hard to assume that new tariffs will trigger another fall in the dollar. Many already expect a significant slowdown or even a recession in the US economy. Naturally, the dollar cannot remain in demand if the economy is set to slow sharply, and the dollar is no longer considered a "safe haven" asset.
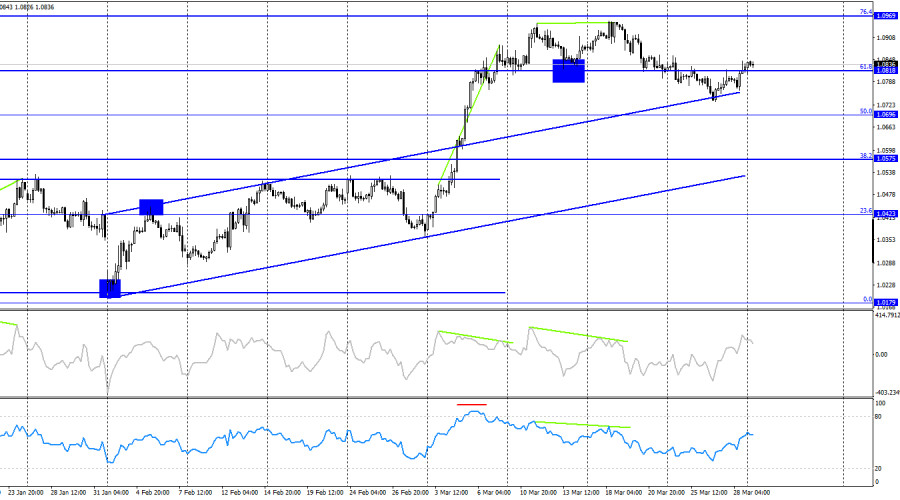
On the 4-hour chart, the pair reversed in favor of the euro and consolidated above the 61.8% Fibonacci correction level at 1.0818. Thus, the upward trend may resume toward the 76.4% Fibonacci level at 1.0969. The bullish trend remains intact, and no signs of divergence are currently observed in any indicator.
Commitments of Traders (COT) Report:
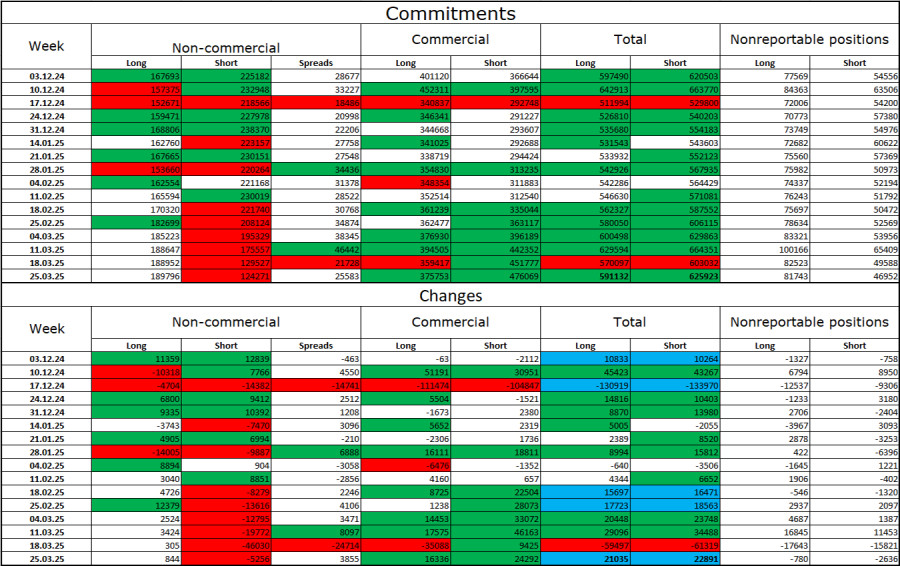
During the last reporting week, professional traders opened 844 Long positions and closed 5,256 Short positions. The sentiment of the "Non-commercial" group has turned bullish again—thanks to Donald Trump. The total number of Long positions held by speculators now stands at 190,000, while Short positions total 124,000.
For twenty consecutive weeks, large players were reducing their euro holdings, but now for seven weeks in a row, they have been unwinding Shorts and increasing Longs. The divergence in monetary policy approaches between the ECB and the Fed still favors the US dollar due to rate differentials. However, Donald Trump's policies have become a more significant factor for traders, as they may prompt dovish shifts in the FOMC's stance and potentially trigger a US recession.
Economic calendar for the US and the Eurozone:
Eurozone – Germany Retail Sales Change (08:55 UTC) Eurozone – Germany Consumer Price Index (12:00 UTC) US – Chicago PMI (13:45 UTC)
On March 31, the economic calendar contains three entries, with only the German inflation data drawing notable attention. The influence of the news background on market sentiment may remain weak on Monday.
EUR/USD Forecast and Trader Tips:
Short positions are possible today upon a rebound from the 1.0857 level on the hourly chart, with targets at 1.0734. Long positions may be considered upon a rebound from the 1.0781–1.0797 zone on the hourly chart with a target at 1.0857, or upon a close above 1.0857 with a target at 1.0944.
Fibonacci levels are drawn from 1.0529–1.0213 on the hourly chart and from 1.1214–1.0179 on the 4-hour chart.
You have already liked this post today
* Analisis pasaran yang disiarkan di sini adalah bertujuan untuk meningkatkan kesedaran anda, tetapi tidak untuk memberi arahan untuk membuat perdagangan.
Harga emas baru-baru ini mengalami pembetulan yang ketara berikutan jangkaan pasaran terhadap permulaan rundingan sebenar antara Amerika Syarikat dan China berhubung tarif serta perdagangan secara keseluruhan. Kenyataan Setiausaha Perbendaharaan
Pada carta 4 jam, instrumen komoditi Silver kelihatan meskipun keadaannya mengukuh di mana ini disahkan oleh pergerakan harga Silver yang bergerak di atas WMA (30 Shift 2) yang juga mempunyai
Walaupun pada carta 4 jam indeks Nasdaq 100 berada dalam keadaan mendatar (Sideways), julat pergerakannya masih cukup luas, sekali gus menawarkan peluang yang agak menarik pada indeks ini. Ketika
Rancangan dagangan kami untuk beberapa jam akan datang adalah menjual emas di bawah $3,333, dengan sasaran pada $3,313 dan $3,291. Kami boleh membeli di atas $3,280 dengan sasaran jangka pendek
Dengan kemunculan Divergence antara pergerakan harga pasangan mata wang silang AUD/JPY dengan penunjuk Pengayun Stochastic dan pergerakan harga AUD/JPY yang berada di atas WMA (30 Shift 2) yang juga mempunyai
Jika kita melihat carta 4 jam, instrumen komoditi Emas masih menunjukkan kecenderungan Menaik, namun kemunculan Perbezaan (Divergence) antara pergerakan harga Emas dan penunjuk Pengayun Stochastic memberi isyarat bahawa dalam masa
Jika kita meneliti carta 4 jam bagi pasangan silang mata wang GBP/CHF, terdapat beberapa fakta menarik. Pertama sekali, kemunculan corak Segitiga yang diiringi oleh purata bergerak eksponen EMA (21) yang
Dengan pergerakan harga pasangan mata wang silang AUD/CAD bergerak di atas WMA (21) yang mempunyai cerun menaik dan penampilan Konvergensi antara pergerakan harga AUD/CAD dan penunjuk Pengayun Stochastic, ia memberikan
Penunjuk eagle telah mencapai tahap terlebih beli. Walau bagaimanapun, logam tersebut masih boleh mencapai paras tinggi sekitar 8/8 Murray, yang mewakili rintangan kuat untuk emas. Di bawah kawasan ini, kita
Dari pemerhatian pada carta 4 jam, pasangan mata wang silang EUR/GBP kelihatan bergerak di atas EMA (100), yang menunjukkan bahawa Pembeli mendominasi pasangan mata wang ini. Oleh itu, dalam masa
InstaTrade dalam angka

Your IP address shows that you are currently located in the USA. If you are a resident of the United States, you are prohibited from using the services of InstaFintech Group including online trading, online transfers, deposit/withdrawal of funds, etc.
If you think you are seeing this message by mistake and your location is not the US, kindly proceed to the website. Otherwise, you must leave the website in order to comply with government restrictions.
Why does your IP address show your location as the USA?
Please confirm whether you are a US resident or not by clicking the relevant button below. If you choose the wrong option, being a US resident, you will not be able to open an account with InstaTrade anyway.
We are sorry for any inconvenience caused by this message.


