Lihat juga

 02.10.2024 03:31 PM
On Tuesday, the EUR/USD pair continued to decline, closing below the support zone of 1.1070 – 1.1081 by the end of the day. This suggests that the euro's decline may continue today towards the next Fibonacci level of 127.2% – 1.0984. A close above the 1.1070 – 1.1081 zone will favor the euro and could lead to a resumption of growth towards the 200.0% retracement level at 1.1165.
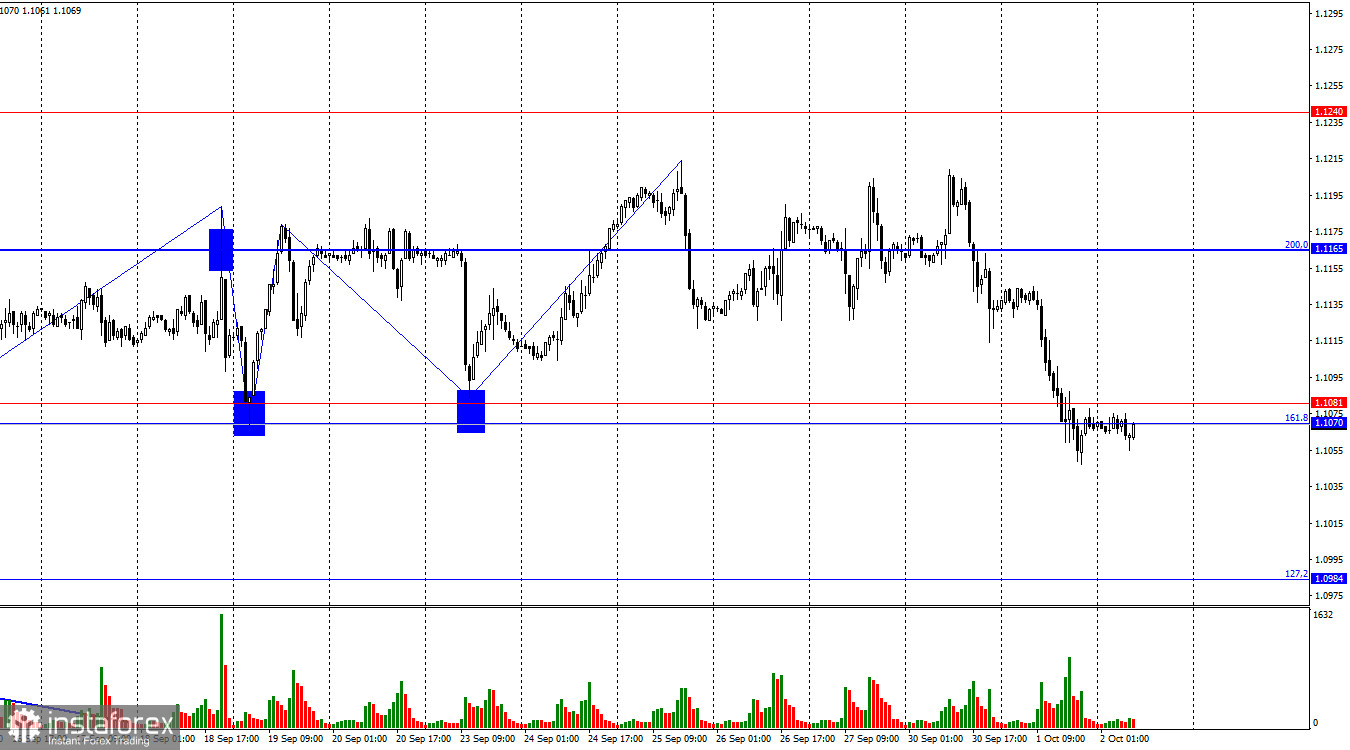
The wave situation has become slightly more complicated, but overall, it does not raise any major concerns. The last completed upward wave (September 23-25) broke the peaks of previous waves, while the most recent downward wave broke the lows of the previous two waves. As a result, the pair has either entered a complex sideways movement or is very slowly beginning to form a new bearish trend. A consolidation below the 1.1070 – 1.1081 support zone suggests further decline, but a pullback may occur over the next day or two.
Tuesday's news once again gave bears opportunities to act in the market. After Germany's inflation fell to 1.6% year-on-year, it became known that inflation in the EU dropped to 1.8% year-on-year. In both cases, the ECB's target level was missed. Core inflation in the EU decreased to 2.7% year-on-year, but it continues to slow down almost every month. As a result, the chances of ECB monetary policy easing in October and December are increasing. Before the inflation reports, traders had only expected one rate cut by the end of the year, but now there could be two, which weakens the bullish sentiment and makes the euro more vulnerable. It's also worth noting that the ISM manufacturing index in the U.S. remained below 50.0, meaning bears couldn't capitalize on that report. But even without it, they have gained the upper hand in the market for the first time in a long while. Given the wave analysis, I expect further decline.
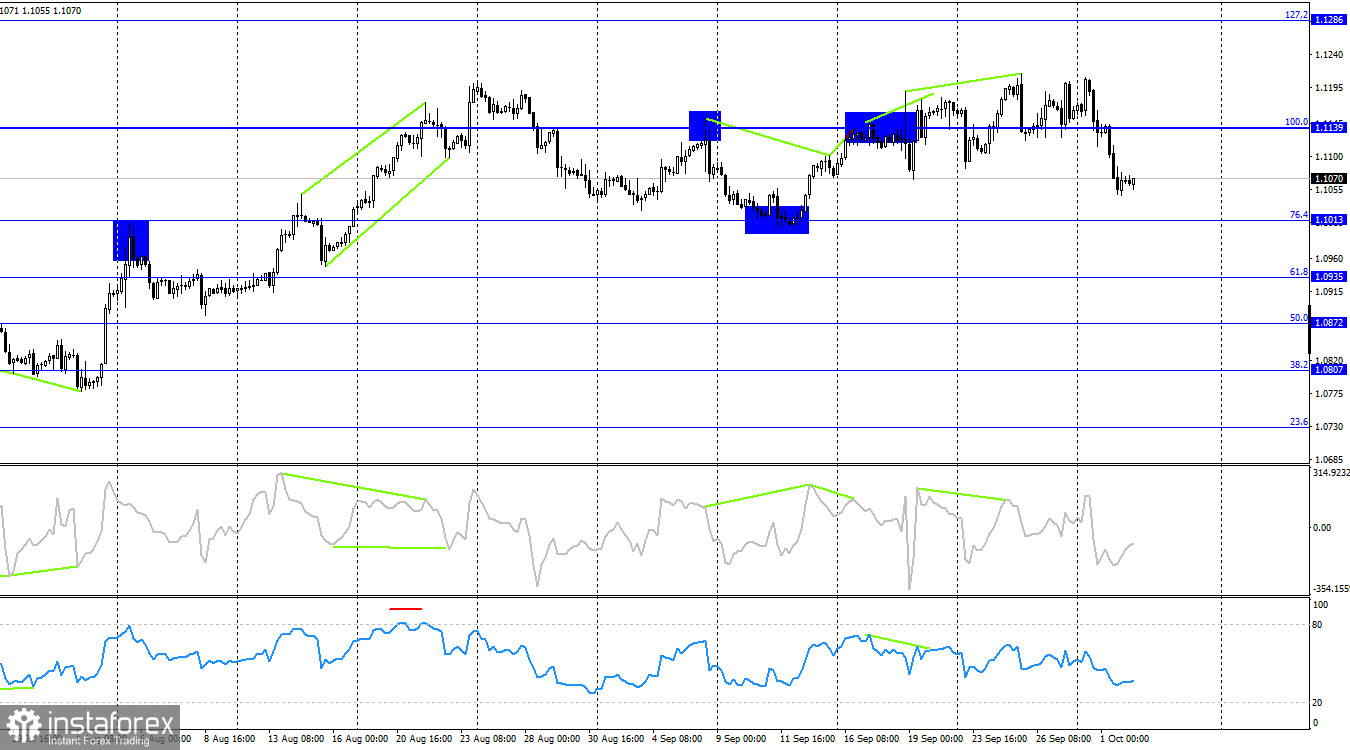
On the 4-hour chart, the pair reversed in favor of the U.S. dollar after a series of bearish divergences appeared on the RSI and CCI indicators. The RSI also entered the overbought zone a few weeks ago, and now another bearish divergence has appeared on the CCI indicator. However, considering the strength and momentum of the bulls, a sharp decline in the euro still seems unlikely. Bears may start to face resistance around the 1.1013 level, but a consolidation below this level would allow them to extend their downward movement.
Commitments of Traders (COT) Report:
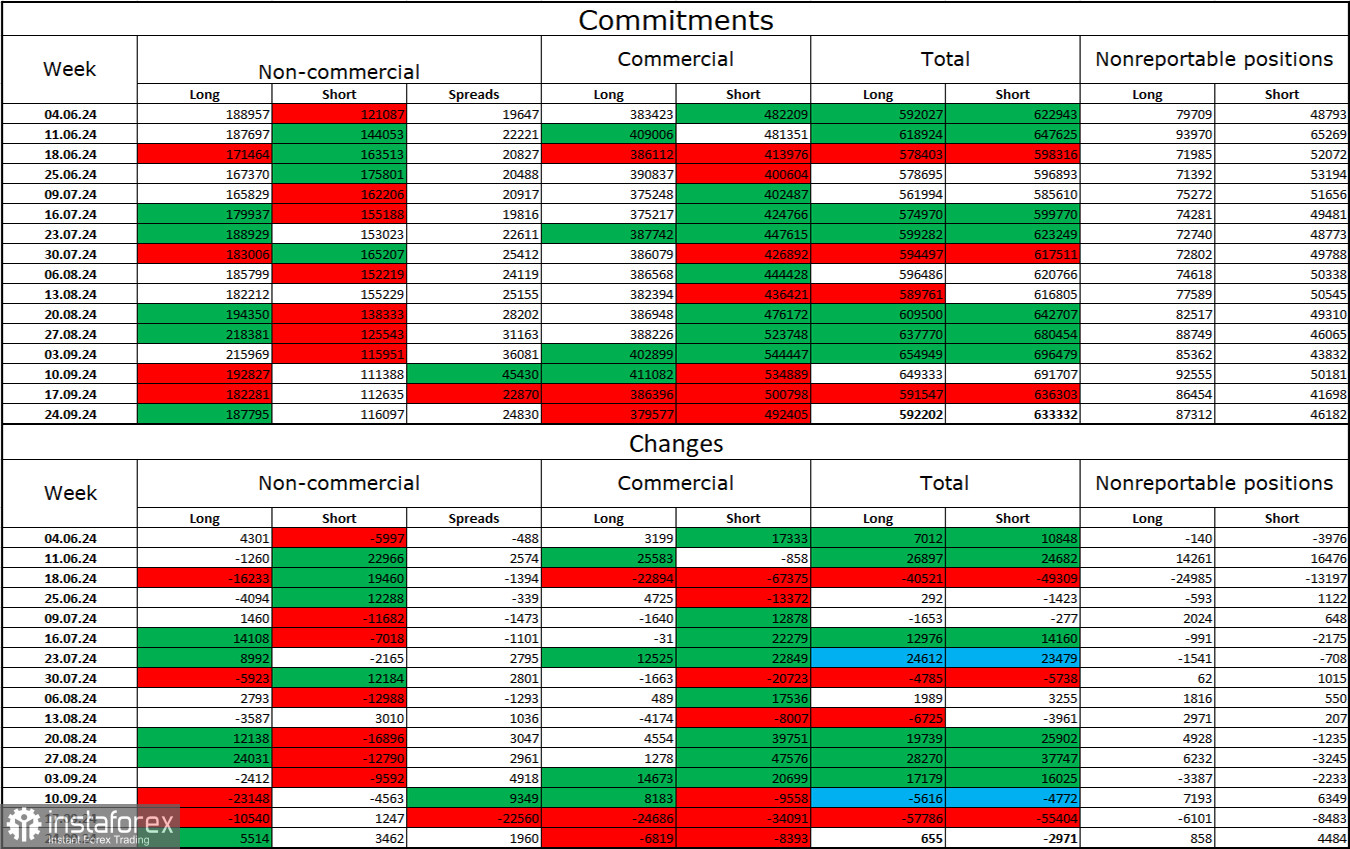
In the latest reporting week, speculators opened 5,514 long positions and 3,462 short positions. The sentiment of the "Non-commercial" group turned bearish a few months ago, but bulls are now actively dominating again. The total number of long positions held by speculators now stands at 188,000 while short positions total only 116,000.
However, for the third week in a row, major players are increasingly offloading the euro. In my opinion, this could be a precursor to a new bearish trend or at least a correction. The key factor that had been driving the dollar down – expectations of FOMC monetary policy easing – has played out, and there are no longer reasons for the dollar to weaken. New reasons may emerge over time, but for now, the growth of the U.S. dollar seems more likely. Active selling of the euro has not yet begun, but if it does, the chances of a bearish trend will increase.
News Calendar for the U.S. and the EU:
EU – Unemployment rate (09:00 UTC)U.S. – ADP Nonfarm Employment Change (12:15 UTC)
The economic calendar for October 2 includes two important events, particularly the ADP report. The influence of this news on market sentiment today could be significant.
Forecast for EUR/USD and trading tips:
Selling the pair was possible after closing below 1.1139 on the 4-hour chart, with targets at 1.1081 and 1.1070. Both targets have been reached. Sales can be held with targets at 1.1013 and 1.0984 if the price remains below the 1.1070 – 1.1081 zone today. I would not consider buying the pair now, as it is highly likely that the pair is attempting to start a bearish trend.
The Fibonacci grids are drawn from 1.0917 – 1.0668 on the hourly chart and from 1.1139 – 1.0603 on the 4-hour chart.
You have already liked this post today
* Analisis pasaran yang disiarkan di sini adalah bertujuan untuk meningkatkan kesedaran anda, tetapi tidak untuk memberi arahan untuk membuat perdagangan.


