

Өзекті паттерндер

Двойное дно
сформирован 16.04 в 06:31:16 (UTC+0)
сила сигнала 2 из 5
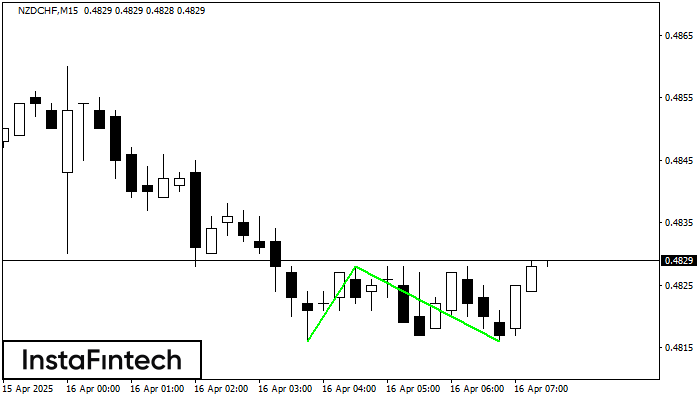
Сформирована фигура «Двойное дно» на графике NZDCHF M15. Верхняя граница 0.4828; Нижняя граница 0.4816; Ширина фигуры 12 пунктов. В случае пробоя верхней границы 0.4828 можно будет прогнозировать изменение тенденции, где ширина фигуры и будет являться расстоянием предположительного Тейк Профита.
Таймфреймы М5 и М15 могут иметь больше ложных точек входа.
- Все
- Все
- Bearish Rectangle
- Bearish Symmetrical Triangle
- Bearish Symmetrical Triangle
- Bullish Rectangle
- Double Top
- Double Top
- Triple Bottom
- Triple Bottom
- Triple Top
- Triple Top
- Все
- Все
- Покупка
- Продажа
- Все
- 1
- 2
- 3
- 4
- 5
Triple Bottom
was formed on 23.04 at 20:00:49 (UTC+0)
signal strength 1 of 5
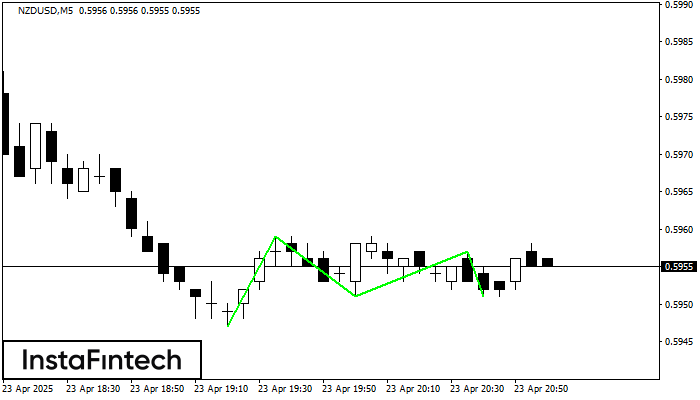
The Triple Bottom pattern has been formed on NZDUSD M5. It has the following characteristics: resistance level 0.5959/0.5957; support level 0.5947/0.5951; the width is 12 points. In the event
The M5 and M15 time frames may have more false entry points.
Open chart in a new window
Double Bottom
was formed on 23.04 at 20:00:30 (UTC+0)
signal strength 1 of 5
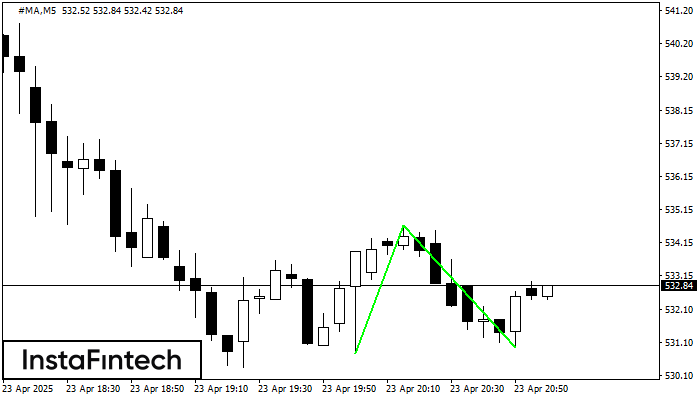
The Double Bottom pattern has been formed on #MA M5. This formation signals a reversal of the trend from downwards to upwards. The signal is that a buy trade should
The M5 and M15 time frames may have more false entry points.
Open chart in a new window
Bullish pennant
was formed on 23.04 at 20:00:19 (UTC+0)
signal strength 3 of 5
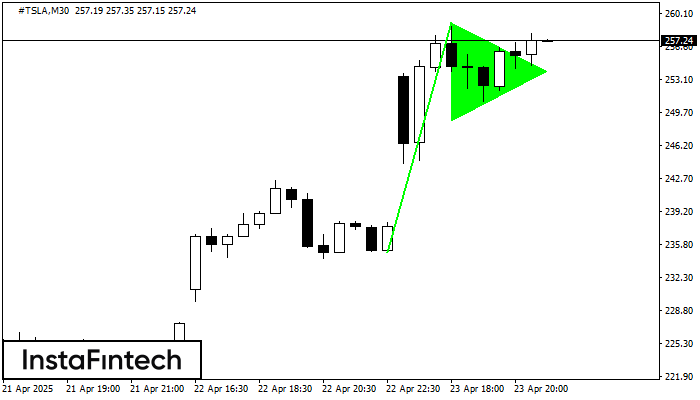
The Bullish pennant graphic pattern has formed on the #TSLA M30 instrument. This pattern type falls under the category of continuation patterns. In this case, if the quote can breaks
Open chart in a new window


