Өзекті паттерндер

Двойное дно
сформирован 02.04 в 14:31:55 (UTC+0)
сила сигнала 2 из 5
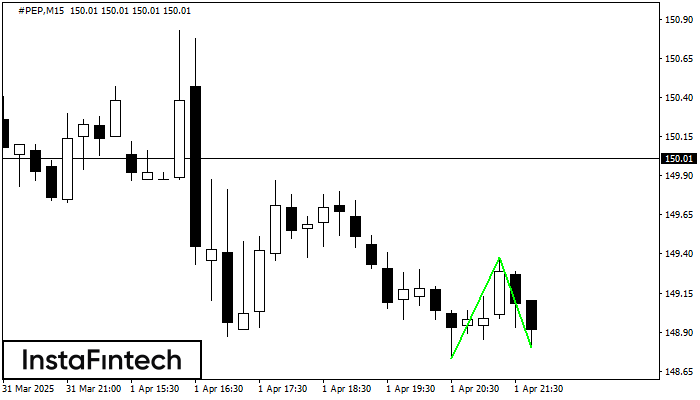
Сформирована фигура «Двойное дно» на графике #PEP M15. Верхняя граница 149.38; Нижняя граница 148.80; Ширина фигуры 65 пунктов. В случае пробоя верхней границы 149.38 можно будет прогнозировать изменение тенденции, где ширина фигуры и будет являться расстоянием предположительного Тейк Профита.
Таймфреймы М5 и М15 могут иметь больше ложных точек входа.
Сондай-ақ қараңыз
- Все
- Все
- Bearish Rectangle
- Bearish Symmetrical Triangle
- Bearish Symmetrical Triangle
- Bullish Rectangle
- Double Top
- Double Top
- Triple Bottom
- Triple Bottom
- Triple Top
- Triple Top
- Все
- Все
- Покупка
- Продажа
- Все
- 1
- 2
- 3
- 4
- 5
Bearish Rectangle
сформирован 16.04 в 14:05:33 (UTC+0)
сила сигнала 1 из 5
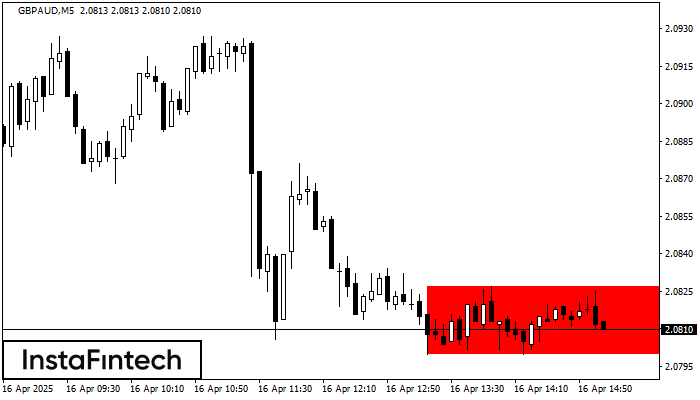
According to the chart of M5, GBPAUD formed the Bearish Rectangle. This type of a pattern indicates a trend continuation. It consists of two levels: resistance 2.0827 - 0.0000
The M5 and M15 time frames may have more false entry points.
Открыть график инструмента в новом окне
Triple Top
сформирован 16.04 в 13:40:08 (UTC+0)
сила сигнала 1 из 5
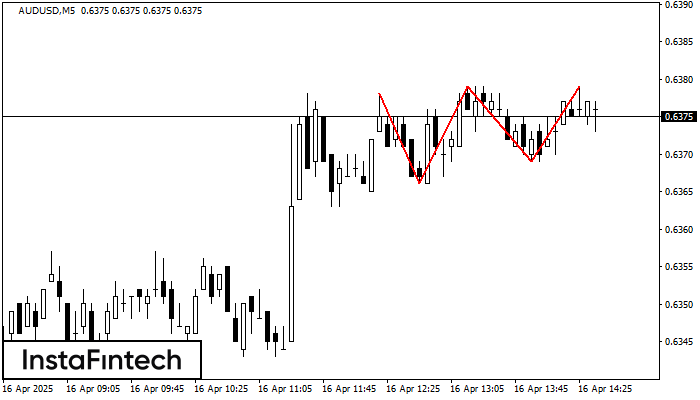
On the chart of the AUDUSD M5 trading instrument, the Triple Top pattern that signals a trend change has formed. It is possible that after formation of the third peak
The M5 and M15 time frames may have more false entry points.
Открыть график инструмента в новом окне
Triple Bottom
сформирован 16.04 в 13:30:30 (UTC+0)
сила сигнала 1 из 5
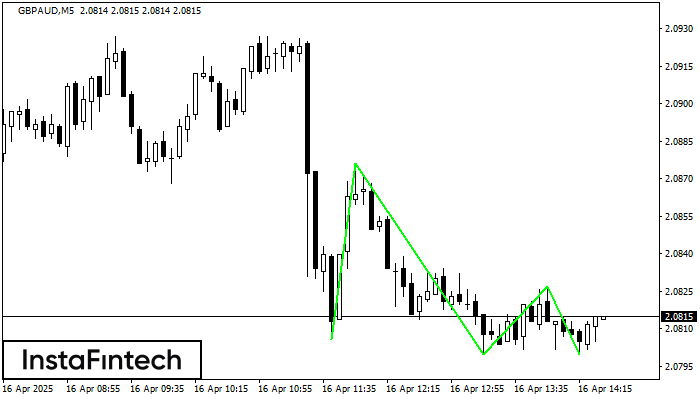
The Triple Bottom pattern has formed on the chart of the GBPAUD M5 trading instrument. The pattern signals a change in the trend from downwards to upwards in the case
The M5 and M15 time frames may have more false entry points.
Открыть график инструмента в новом окне