Өзекті паттерндер

Бычий флаг
сформирован 01.04 в 22:25:56 (UTC+0)
сила сигнала 1 из 5

На графике AUDCHF M5 сформировалась фигура «Бычий флаг», которая сигнализирует о продолжении восходящего тренда. Сигналы: Пробой максимума фигуры 0.5551 может привести к продолжению восходящего движения, где рост инструмента будет являться проекцией высоты флагштока.
Таймфреймы М5 и М15 могут иметь больше ложных точек входа.
Сондай-ақ қараңыз
- Все
- Все
- Bearish Rectangle
- Bearish Symmetrical Triangle
- Bearish Symmetrical Triangle
- Bullish Rectangle
- Double Top
- Double Top
- Triple Bottom
- Triple Bottom
- Triple Top
- Triple Top
- Все
- Все
- Покупка
- Продажа
- Все
- 1
- 2
- 3
- 4
- 5
Double Top
сформирован 21.04 в 20:31:25 (UTC+0)
сила сигнала 1 из 5
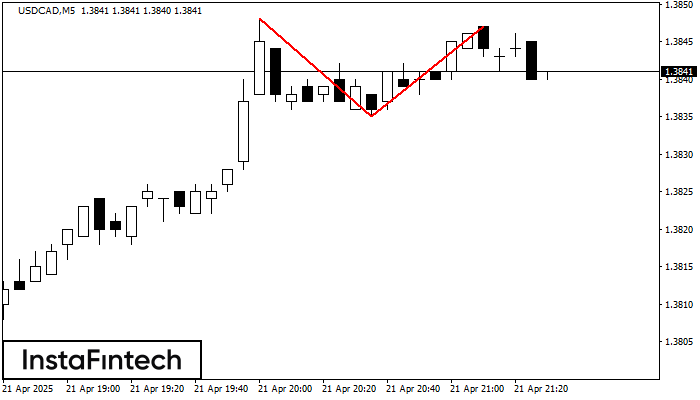
The Double Top pattern has been formed on USDCAD M5. It signals that the trend has been changed from upwards to downwards. Probably, if the base of the pattern 1.3835
The M5 and M15 time frames may have more false entry points.
Открыть график инструмента в новом окне
Double Bottom
сформирован 21.04 в 20:30:22 (UTC+0)
сила сигнала 2 из 5
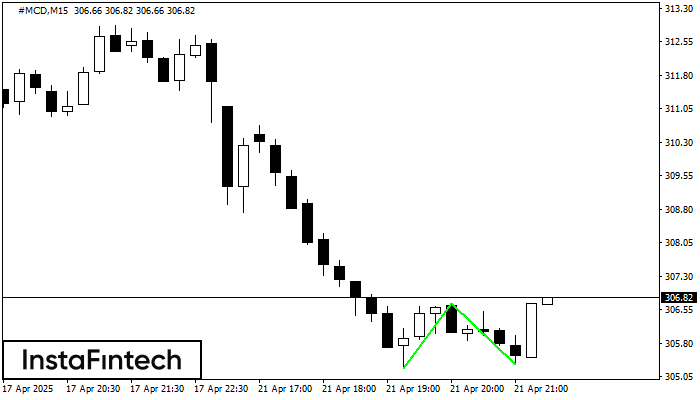
The Double Bottom pattern has been formed on #MCD M15. Characteristics: the support level 305.24; the resistance level 306.70; the width of the pattern 146 points. If the resistance level
The M5 and M15 time frames may have more false entry points.
Открыть график инструмента в новом окне
Double Top
сформирован 21.04 в 20:25:24 (UTC+0)
сила сигнала 1 из 5
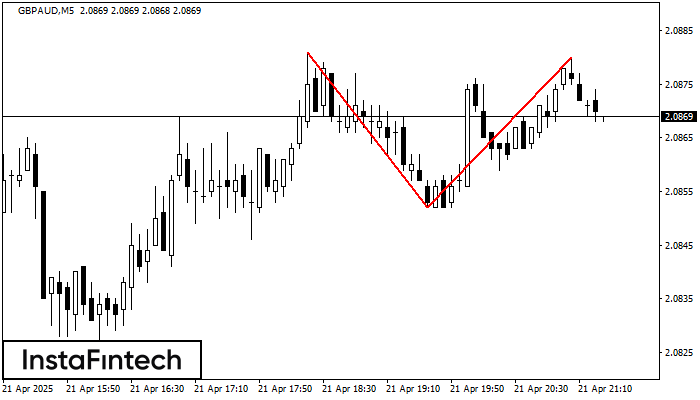
On the chart of GBPAUD M5 the Double Top reversal pattern has been formed. Characteristics: the upper boundary 2.0880; the lower boundary 2.0852; the width of the pattern 28 points
The M5 and M15 time frames may have more false entry points.
Открыть график инструмента в новом окне