Өзекті паттерндер

Двойное дно
сформирован 29.03 в 11:00:31 (UTC+0)
сила сигнала 3 из 5

Сформирована фигура «Двойное дно» на графике #Bitcoin M30. Характеристика: Уровень поддержки 83552.05; Уровень сопротивления 84588.82; Ширина фигуры 103677 пунктов. В случае пробоя уровня сопротивления можно будет прогнозировать изменение тенденции, где первая точка фиксации прибыли находится на расстоянии 96966 пунктов.
- Все
- Все
- Bearish Rectangle
- Bearish Symmetrical Triangle
- Bearish Symmetrical Triangle
- Bullish Rectangle
- Double Top
- Double Top
- Triple Bottom
- Triple Bottom
- Triple Top
- Triple Top
- Все
- Все
- Покупка
- Продажа
- Все
- 1
- 2
- 3
- 4
- 5
Bullish Rectangle
сформирован 22.04 в 22:14:12 (UTC+0)
сила сигнала 1 из 5

According to the chart of M5, GBPCHF formed the Bullish Rectangle which is a pattern of a trend continuation. The pattern is contained within the following borders: the lower border
The M5 and M15 time frames may have more false entry points.
Открыть график инструмента в новом окне
Triple Top
сформирован 22.04 в 21:55:10 (UTC+0)
сила сигнала 1 из 5
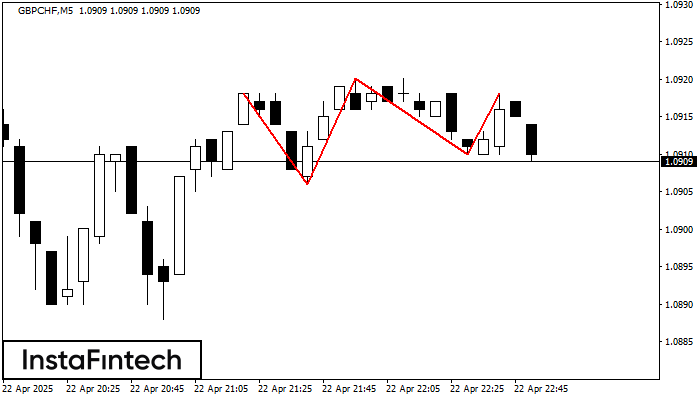
The Triple Top pattern has formed on the chart of the GBPCHF M5. Features of the pattern: borders have an ascending angle; the lower line of the pattern
The M5 and M15 time frames may have more false entry points.
Открыть график инструмента в новом окне
Bullish Symmetrical Triangle
сформирован 22.04 в 21:45:54 (UTC+0)
сила сигнала 1 из 5

According to the chart of M5, #EBAY formed the Bullish Symmetrical Triangle pattern, which signals the trend will continue. Description. The upper border of the pattern touches the coordinates 67.70/67.05
The M5 and M15 time frames may have more false entry points.
Открыть график инструмента в новом окне