Өзекті паттерндер

Двойное дно
сформирован 27.03 в 00:00:29 (UTC+0)
сила сигнала 3 из 5

Сформирована фигура «Двойное дно» на графике NZDCAD M30. Верхняя граница 0.8209; Нижняя граница 0.8165; Ширина фигуры 43 пунктов. В случае пробоя верхней границы 0.8209 можно будет прогнозировать изменение тенденции, где ширина фигуры и будет являться расстоянием предположительного Тейк Профита.
- Все
- Все
- Bearish Rectangle
- Bearish Symmetrical Triangle
- Bearish Symmetrical Triangle
- Bullish Rectangle
- Double Top
- Double Top
- Triple Bottom
- Triple Bottom
- Triple Top
- Triple Top
- Все
- Все
- Покупка
- Продажа
- Все
- 1
- 2
- 3
- 4
- 5
Triple Bottom
сформирован 14.04 в 03:00:24 (UTC+0)
сила сигнала 2 из 5

The Triple Bottom pattern has been formed on EURNZD M15. It has the following characteristics: resistance level 1.9498/1.9463; support level 1.9409/1.9402; the width is 89 points. In the event
The M5 and M15 time frames may have more false entry points.
Открыть график инструмента в новом окне
Bullish Symmetrical Triangle
сформирован 14.04 в 02:51:59 (UTC+0)
сила сигнала 1 из 5

According to the chart of M5, GBPAUD formed the Bullish Symmetrical Triangle pattern. The lower border of the pattern touches the coordinates 2.0704/2.0775 whereas the upper border goes across 2.0831/2.0775
The M5 and M15 time frames may have more false entry points.
Открыть график инструмента в новом окне
Double Top
сформирован 14.04 в 02:30:27 (UTC+0)
сила сигнала 2 из 5
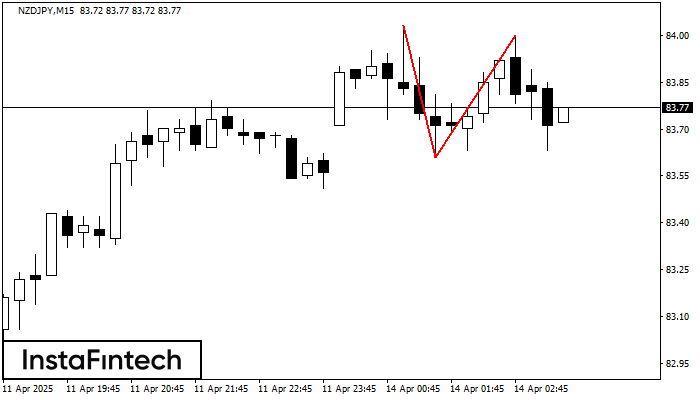
The Double Top reversal pattern has been formed on NZDJPY M15. Characteristics: the upper boundary 84.03; the lower boundary 83.61; the width of the pattern is 39 points. Sell trades
The M5 and M15 time frames may have more false entry points.
Открыть график инструмента в новом окне