वास्तविक पैटर्न

पैटर्न ग्राफिकल मॉडल हैं जो चार्ट में मूल्य से बने होते हैं। तकनीकी विश्लेषण भविष्यवाणियों में से एक के अनुसार, इतिहास का मतलब मूल्य आंदोलन खुद को दोहराता है। इसका मतलब है कि मूल्य आंदोलन अक्सर एक ही परिस्थितियों में समान होते हैं जो उच्च संभावना के साथ स्थिति के आगे के विकास की भविष्यवाणी करना संभव बनाता है।
इंस्टा फॉरेक्स द्वारा प्रासंगिक पैटर्न एक उपयोग में आसान सेवा है जो आपको बाजार में नवीनतम परिवर्तनों के बारे में जागरूक होने और समय पर बाजार से संकेतों पर प्रतिक्रिया करने की अनुमति देती है। हमारी सेवा में आप हमेशा किसी भी जोड़ी और किसी भी समय सीमा पर नवीनतम और सबसे प्रासंगिक पैटर्न प्राप्त कर सकते हैं.
Bearish Symmetrical Triangle
was formed on 03.04 at 20:05:13 (UTC+0)
signal strength 1 of 5
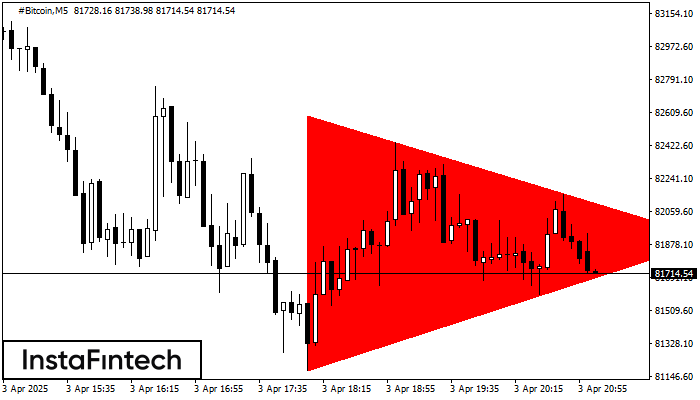
According to the chart of M5, #Bitcoin formed the Bearish Symmetrical Triangle pattern. Description: The lower border is 81178.46/81904.02 and upper border is 82588.16/81904.02. The pattern width is measured on the chart at -140970 pips. The formation of the Bearish Symmetrical Triangle pattern evidently signals a continuation of the downward trend. In other words, if the scenario comes true and #Bitcoin breaches the lower border, the price could continue its move toward 81903.87.
The M5 and M15 time frames may have more false entry points.
- All
- All
- Bearish Rectangle
- Bearish Symmetrical Triangle
- Bearish Symmetrical Triangle
- Bullish Rectangle
- Double Top
- Double Top
- Triple Bottom
- Triple Bottom
- Triple Top
- Triple Top
- All
- All
- Buy
- Sale
- All
- 1
- 2
- 3
- 4
- 5
बुलिश सिमेट्रिकल त्रिभुज
was formed on 05.04 at 06:31:21 (UTC+0)
signal strength 2 of 5

M15 के चार्ट के अनुसार, #Bitcoin से बुलिश सिमेट्रिकल त्रिभुज पैटर्न बना। पैटर्न की निचली सीमा ने निर्देशांक 83167.44/83888.94 को स्पर्श किया जबकि ऊपरी सीमा 84422.11/83888.94 के पार गई। यदि
M5 और M15 समय सीमा में अधिक फाल्स एंट्री पॉइंट्स हो सकते हैं।
Open chart in a new window
बियरिश आयत
was formed on 05.04 at 02:40:31 (UTC+0)
signal strength 4 of 5

H1 के चार्ट के अनुसार, #Bitcoin से बियरिश आयत बना। इस प्रकार का पैटर्न एक प्रवृत्ति निरंतरता को इंगित करता है। इसमें दो स्तर होते हैं: प्रतिरोध 84685.39 - 0.00
Open chart in a new window
बियरिश आयत
was formed on 04.04 at 21:58:39 (UTC+0)
signal strength 1 of 5

M5 के चार्ट के अनुसार, EURUSD से बियरिश आयत बना जो प्रवृत्ति निरंतरता का पैटर्न है। पैटर्न निम्न सीमाओं के भीतर समाहित है: निचली सीमा 1.0924 – 1.0924 और ऊपरी
M5 और M15 समय सीमा में अधिक फाल्स एंट्री पॉइंट्स हो सकते हैं।
Open chart in a new window