वास्तविक पैटर्न

पैटर्न ग्राफिकल मॉडल हैं जो चार्ट में मूल्य से बने होते हैं। तकनीकी विश्लेषण भविष्यवाणियों में से एक के अनुसार, इतिहास का मतलब मूल्य आंदोलन खुद को दोहराता है। इसका मतलब है कि मूल्य आंदोलन अक्सर एक ही परिस्थितियों में समान होते हैं जो उच्च संभावना के साथ स्थिति के आगे के विकास की भविष्यवाणी करना संभव बनाता है।
इंस्टा फॉरेक्स द्वारा प्रासंगिक पैटर्न एक उपयोग में आसान सेवा है जो आपको बाजार में नवीनतम परिवर्तनों के बारे में जागरूक होने और समय पर बाजार से संकेतों पर प्रतिक्रिया करने की अनुमति देती है। हमारी सेवा में आप हमेशा किसी भी जोड़ी और किसी भी समय सीमा पर नवीनतम और सबसे प्रासंगिक पैटर्न प्राप्त कर सकते हैं.
Double Top
was formed on 02.04 at 14:15:11 (UTC+0)
signal strength 1 of 5
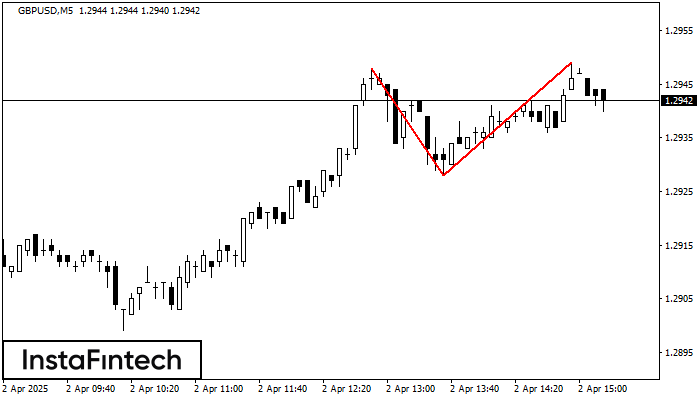
The Double Top reversal pattern has been formed on GBPUSD M5. Characteristics: the upper boundary 1.2948; the lower boundary 1.2928; the width of the pattern is 21 points. Sell trades are better to be opened below the lower boundary 1.2928 with a possible movements towards the 1.2913 level.
The M5 and M15 time frames may have more false entry points.
- All
- All
- Bearish Rectangle
- Bearish Symmetrical Triangle
- Bearish Symmetrical Triangle
- Bullish Rectangle
- Double Top
- Double Top
- Triple Bottom
- Triple Bottom
- Triple Top
- Triple Top
- All
- All
- Buy
- Sale
- All
- 1
- 2
- 3
- 4
- 5
Head and Shoulders
was formed on 09.04 at 03:35:15 (UTC+0)
signal strength 1 of 5
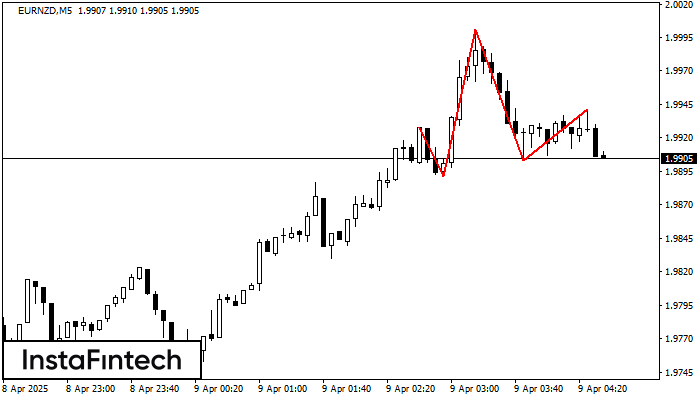
The technical pattern called Head and Shoulders has appeared on the chart of EURNZD M5. There are weighty reasons to suggest that the price will surpass the Neckline 1.9891/1.9903 after
The M5 and M15 time frames may have more false entry points.
Open chart in a new window
Bullish Rectangle
was formed on 09.04 at 02:09:41 (UTC+0)
signal strength 3 of 5
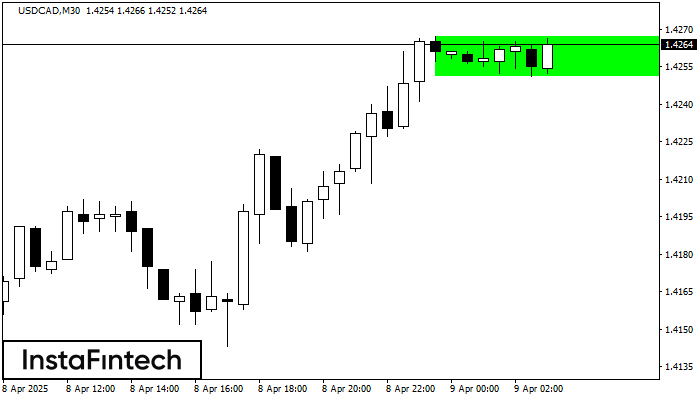
According to the chart of M30, USDCAD formed the Bullish Rectangle. The pattern indicates a trend continuation. The upper border is 1.4267, the lower border is 1.4251. The signal means
Open chart in a new window
Double Top
was formed on 09.04 at 02:00:40 (UTC+0)
signal strength 3 of 5
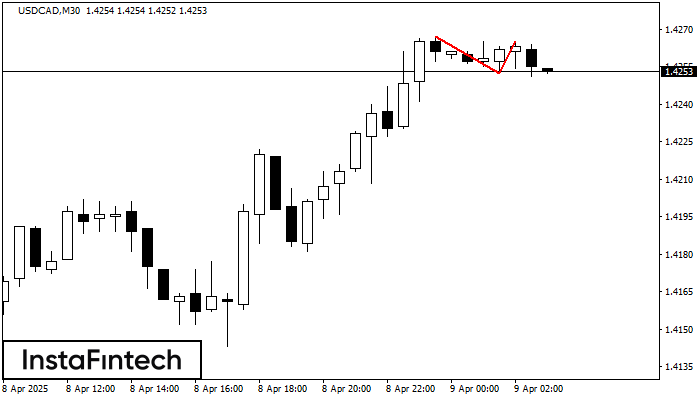
The Double Top pattern has been formed on USDCAD M30. It signals that the trend has been changed from upwards to downwards. Probably, if the base of the pattern 1.4252
Open chart in a new window