वास्तविक पैटर्न

पैटर्न ग्राफिकल मॉडल हैं जो चार्ट में मूल्य से बने होते हैं। तकनीकी विश्लेषण भविष्यवाणियों में से एक के अनुसार, इतिहास का मतलब मूल्य आंदोलन खुद को दोहराता है। इसका मतलब है कि मूल्य आंदोलन अक्सर एक ही परिस्थितियों में समान होते हैं जो उच्च संभावना के साथ स्थिति के आगे के विकास की भविष्यवाणी करना संभव बनाता है।
इंस्टा फॉरेक्स द्वारा प्रासंगिक पैटर्न एक उपयोग में आसान सेवा है जो आपको बाजार में नवीनतम परिवर्तनों के बारे में जागरूक होने और समय पर बाजार से संकेतों पर प्रतिक्रिया करने की अनुमति देती है। हमारी सेवा में आप हमेशा किसी भी जोड़ी और किसी भी समय सीमा पर नवीनतम और सबसे प्रासंगिक पैटर्न प्राप्त कर सकते हैं.
Inverse Head and Shoulder
was formed on 27.03 at 03:00:24 (UTC+0)
signal strength 2 of 5
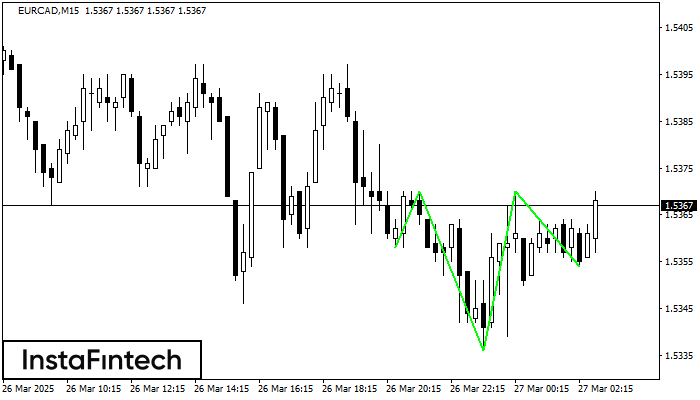
According to the chart of M15, EURCAD formed the Inverse Head and Shoulder pattern. The Head’s top is set at 1.5370 while the median line of the Neck is found at 1.5336/1.5354. The formation of the Inverse Head and Shoulder pattern evidently signals a reversal of the downward trend. In other words, in case the scenario comes true, the price of EURCAD will go towards 1.5393
The M5 and M15 time frames may have more false entry points.
- All
- All
- Bearish Rectangle
- Bearish Symmetrical Triangle
- Bearish Symmetrical Triangle
- Bullish Rectangle
- Double Top
- Double Top
- Triple Bottom
- Triple Bottom
- Triple Top
- Triple Top
- All
- All
- Buy
- Sale
- All
- 1
- 2
- 3
- 4
- 5
Segitiga Simetris Bullish
was formed on 05.04 at 06:31:21 (UTC+0)
signal strength 2 of 5

Menurut Grafik dari M15, #Bitcoin dibentuk pola Segitiga Simetris Bullish. Batas yang lebih rendah dari pola menyentuh kordinat 83167.44/83888.94 dimana batas atas berada sepanjang 84422.11/83888.94. Jika pola Segitiga Simetris Bullish
Rangka waktu M5 dan M15 mungkin memiliki lebih dari titik entri yang keliru.
Open chart in a new window
Persegi Bearish
was formed on 05.04 at 02:40:31 (UTC+0)
signal strength 4 of 5

Menurut grafik dari H1, #Bitcoin terbentuk Persegi Bearish. Jenis pola ini menunjukkan kelanjutan tren. Terdiri dari dua tingkat: resistance 84685.39 - 0.00 dan support 81178.46 – 81178.46. Jika level resistance
Open chart in a new window
Persegi Bearish
was formed on 04.04 at 21:58:39 (UTC+0)
signal strength 1 of 5

Menurut grafik dari M5, EURUSD terbentuk Persegi Bearish yang merupakan pola dari kelanjutan tren. Pola terkandung di dalam batas berikut: batas lebih rendah 1.0924 – 1.0924 dan batas atas 1.0967
Rangka waktu M5 dan M15 mungkin memiliki lebih dari titik entri yang keliru.
Open chart in a new window