Pola sebenarnya

Bearish Symmetrical Triangle
was formed on 04.04 at 02:03:44 (UTC+0)
signal strength 3 of 5
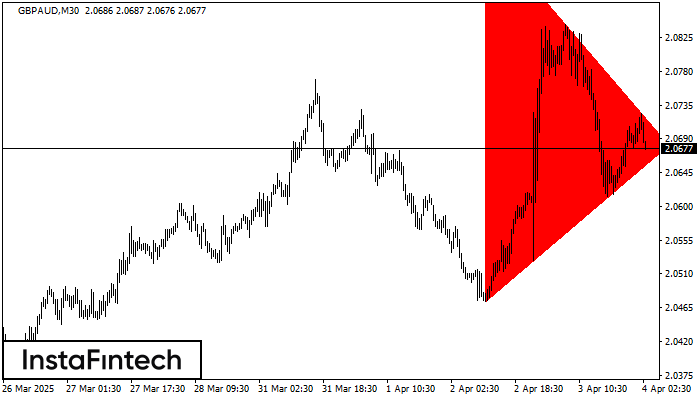
According to the chart of M30, GBPAUD formed the Bearish Symmetrical Triangle pattern. This pattern signals a further downward trend in case the lower border 2.0473 is breached. Here, a hypothetical profit will equal the width of the available pattern that is -495 pips.
Lihat juga
- All
- All
- Bearish Rectangle
- Bearish Symmetrical Triangle
- Bearish Symmetrical Triangle
- Bullish Rectangle
- Double Top
- Double Top
- Triple Bottom
- Triple Bottom
- Triple Top
- Triple Top
- All
- All
- Buy
- Sale
- All
- 1
- 2
- 3
- 4
- 5
Bearish Symmetrical Triangle
сформирован 22.04 в 00:02:54 (UTC+0)
сила сигнала 2 из 5
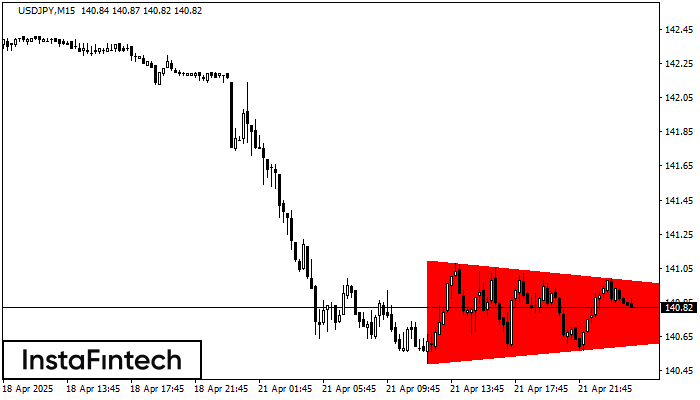
According to the chart of M15, USDJPY formed the Bearish Symmetrical Triangle pattern. Trading recommendations: A breach of the lower border 140.49 is likely to encourage a continuation
The M5 and M15 time frames may have more false entry points.
Открыть график инструмента в новом окне
Inverse Head and Shoulder
сформирован 22.04 в 00:00:27 (UTC+0)
сила сигнала 1 из 5

According to the chart of M5, AUDUSD produced the pattern termed the Inverse Head and Shoulder. The Head is fixed at 0.6402 while the median line of the Neck
The M5 and M15 time frames may have more false entry points.
Открыть график инструмента в новом окне
Bearish Symmetrical Triangle
сформирован 21.04 в 23:42:32 (UTC+0)
сила сигнала 3 из 5

According to the chart of M30, NZDJPY formed the Bearish Symmetrical Triangle pattern. Description: The lower border is 83.98/84.43 and upper border is 84.90/84.43. The pattern width is measured
Открыть график инструмента в новом окне