Pola sebenarnya

Triple Bottom
was formed on 03.04 at 23:00:23 (UTC+0)
signal strength 1 of 5
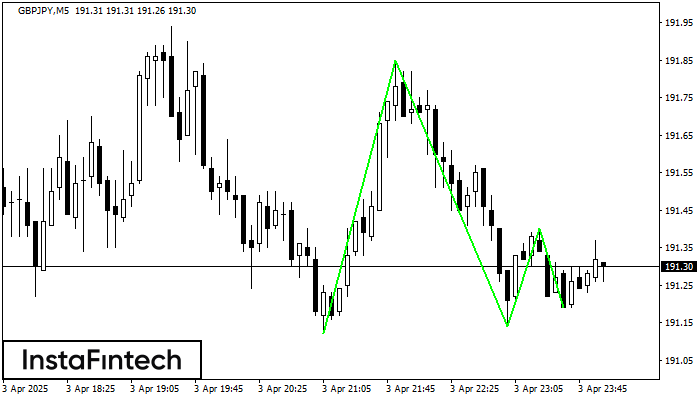
The Triple Bottom pattern has formed on the chart of GBPJPY M5. Features of the pattern: The lower line of the pattern has coordinates 191.85 with the upper limit 191.85/191.40, the projection of the width is 73 points. The formation of the Triple Bottom pattern most likely indicates a change in the trend from downward to upward. This means that in the event of a breakdown of the resistance level 191.12, the price is most likely to continue the upward movement.
The M5 and M15 time frames may have more false entry points.
Lihat juga
- All
- All
- Bearish Rectangle
- Bearish Symmetrical Triangle
- Bearish Symmetrical Triangle
- Bullish Rectangle
- Double Top
- Double Top
- Triple Bottom
- Triple Bottom
- Triple Top
- Triple Top
- All
- All
- Buy
- Sale
- All
- 1
- 2
- 3
- 4
- 5
Persegi Bearish
was formed on 16.04 at 01:07:48 (UTC+0)
signal strength 1 of 5
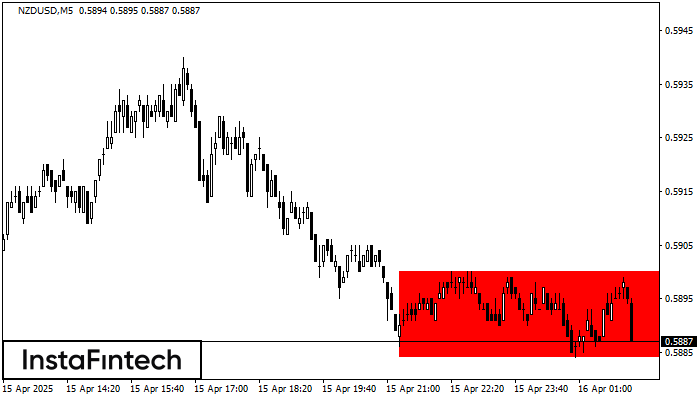
Menurut grafik dari M5, NZDUSD terbentuk Persegi Bearish. Pola menunjukkan kelanjutan tren. Batas atas adalah 0.5900, batas rendah adalah 0.5884. Sinyal berarti posisi jual harus dibuka setelah menetapkan harga dibawah
Rangka waktu M5 dan M15 mungkin memiliki lebih dari titik entri yang keliru.
Open chart in a new window
Teratas Ganda
was formed on 16.04 at 01:05:49 (UTC+0)
signal strength 1 of 5
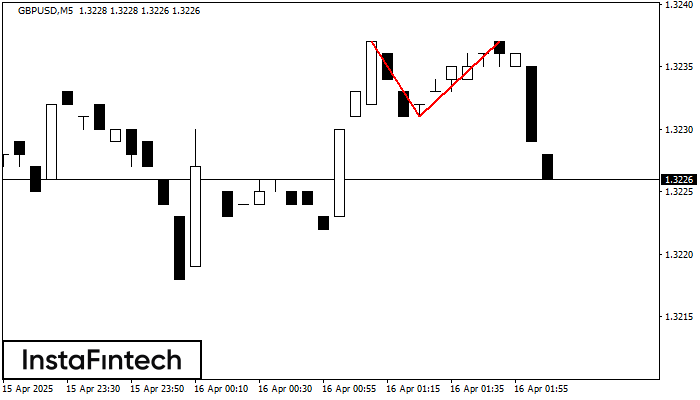
Pola reversal Teratas Ganda telah terbentuk pada GBPUSD M5. Karakteristik: batas atas 1.3237; batas bawah 1.3231; lebar pola 6 poin. Transaksi jual lebih baik dibuka di bawah batas bawah 1.3231
Rangka waktu M5 dan M15 mungkin memiliki lebih dari titik entri yang keliru.
Open chart in a new window
Bawah Ganda
was formed on 16.04 at 00:35:20 (UTC+0)
signal strength 1 of 5

Pola Bawah Ganda telah terbentuk pada #Bitcoin M5; batas atas di 84198.05; batas bawah di 83772.49. Lebar pola sebesar 43677 poin. Jika harga menembus batas atas 84198.05, Perubahan dalam tren
Rangka waktu M5 dan M15 mungkin memiliki lebih dari titik entri yang keliru.
Open chart in a new window