Pola sebenarnya

Triple Top
was formed on 02.04 at 16:00:28 (UTC+0)
signal strength 2 of 5
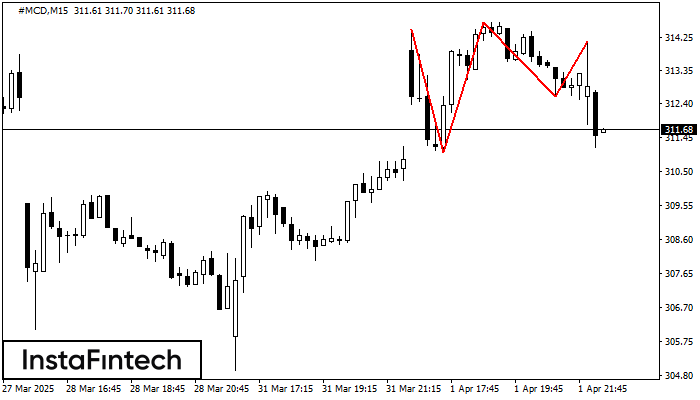
The Triple Top pattern has formed on the chart of the #MCD M15. Features of the pattern: borders have an ascending angle; the lower line of the pattern has the coordinates 311.03/312.60 with the upper limit 314.48/314.14; the projection of the width is 345 points. The formation of the Triple Top figure most likely indicates a change in the trend from upward to downward. This means that in the event of a breakdown of the support level of 311.03, the price is most likely to continue the downward movement.
The M5 and M15 time frames may have more false entry points.
Lihat juga
- All
- All
- Bearish Rectangle
- Bearish Symmetrical Triangle
- Bearish Symmetrical Triangle
- Bullish Rectangle
- Double Top
- Double Top
- Triple Bottom
- Triple Bottom
- Triple Top
- Triple Top
- All
- All
- Buy
- Sale
- All
- 1
- 2
- 3
- 4
- 5
Segitiga Simetris Bullish
was formed on 05.04 at 06:31:21 (UTC+0)
signal strength 2 of 5

Menurut Grafik dari M15, #Bitcoin dibentuk pola Segitiga Simetris Bullish. Batas yang lebih rendah dari pola menyentuh kordinat 83167.44/83888.94 dimana batas atas berada sepanjang 84422.11/83888.94. Jika pola Segitiga Simetris Bullish
Rangka waktu M5 dan M15 mungkin memiliki lebih dari titik entri yang keliru.
Open chart in a new window
Persegi Bearish
was formed on 05.04 at 02:40:31 (UTC+0)
signal strength 4 of 5

Menurut grafik dari H1, #Bitcoin terbentuk Persegi Bearish. Jenis pola ini menunjukkan kelanjutan tren. Terdiri dari dua tingkat: resistance 84685.39 - 0.00 dan support 81178.46 – 81178.46. Jika level resistance
Open chart in a new window
Persegi Bearish
was formed on 04.04 at 21:58:39 (UTC+0)
signal strength 1 of 5

Menurut grafik dari M5, EURUSD terbentuk Persegi Bearish yang merupakan pola dari kelanjutan tren. Pola terkandung di dalam batas berikut: batas lebih rendah 1.0924 – 1.0924 dan batas atas 1.0967
Rangka waktu M5 dan M15 mungkin memiliki lebih dari titik entri yang keliru.
Open chart in a new window