Pola sebenarnya

Double Top
was formed on 02.04 at 15:30:34 (UTC+0)
signal strength 2 of 5
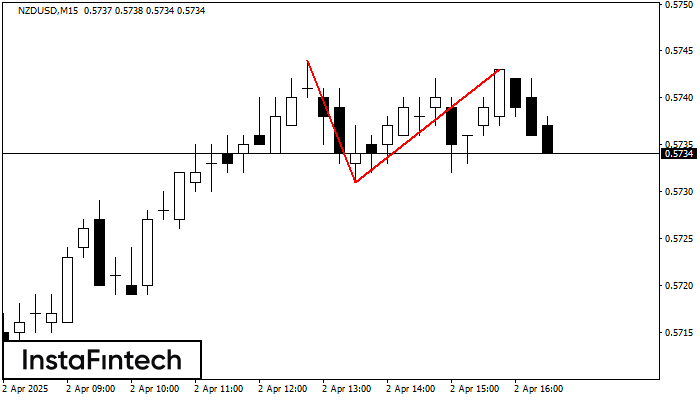
The Double Top reversal pattern has been formed on NZDUSD M15. Characteristics: the upper boundary 0.5744; the lower boundary 0.5731; the width of the pattern is 12 points. Sell trades are better to be opened below the lower boundary 0.5731 with a possible movements towards the 0.5709 level.
The M5 and M15 time frames may have more false entry points.
Lihat juga
- All
- All
- Bearish Rectangle
- Bearish Symmetrical Triangle
- Bearish Symmetrical Triangle
- Bullish Rectangle
- Double Top
- Double Top
- Triple Bottom
- Triple Bottom
- Triple Top
- Triple Top
- All
- All
- Buy
- Sale
- All
- 1
- 2
- 3
- 4
- 5
Bawah Triple
was formed on 21.04 at 22:01:24 (UTC+0)
signal strength 3 of 5

Pola Bawah Triple telah terbentuk pada grafik instrumen trading USDJPY M30. Pola tersebut menandakan perubahan dalam trend dari menurun menjadi naik jika terjadi pemecahan (breakdown) 141.08/141.05
Open chart in a new window
Bawah Ganda
was formed on 21.04 at 22:00:49 (UTC+0)
signal strength 4 of 5

Pola Bawah Ganda telah terbentuk pada AUDCHF H1; batas atas di 0.5198; batas bawah di 0.5165. Lebar pola sebesar 34 poin. Jika harga menembus batas atas 0.5198, Perubahan dalam tren
Open chart in a new window
Segitiga Simetris Bearish
was formed on 21.04 at 21:58:31 (UTC+0)
signal strength 1 of 5
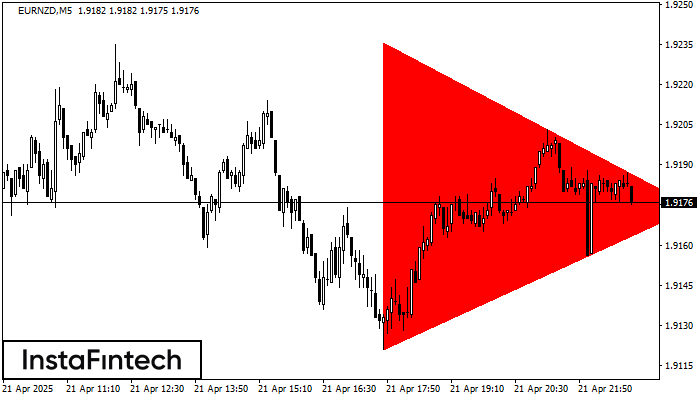
Menurut Grafik dari M5, EURNZD dibentuk pola Segitiga Simetris Bearish. Deskripsi: Batas yang lebih rendah adalah 1.9121/1.9174 dan batas atas adalah 1.9236/1.9174. Lebar pola diukur dalam grafik di -115 pips
Rangka waktu M5 dan M15 mungkin memiliki lebih dari titik entri yang keliru.
Open chart in a new window