

Pola sebenarnya

Triple Bottom
was formed on 26.03 at 11:55:30 (UTC+0)
signal strength 1 of 5
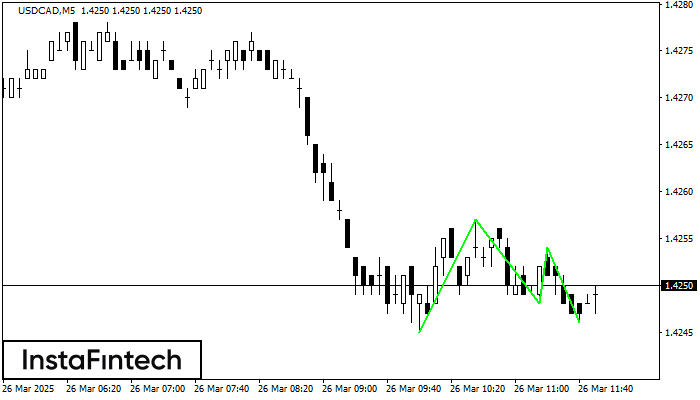
The Triple Bottom pattern has formed on the chart of USDCAD M5. Features of the pattern: The lower line of the pattern has coordinates 1.4257 with the upper limit 1.4257/1.4254, the projection of the width is 12 points. The formation of the Triple Bottom pattern most likely indicates a change in the trend from downward to upward. This means that in the event of a breakdown of the resistance level 1.4245, the price is most likely to continue the upward movement.
The M5 and M15 time frames may have more false entry points.
- All
- All
- Bearish Rectangle
- Bearish Symmetrical Triangle
- Bearish Symmetrical Triangle
- Bullish Rectangle
- Double Top
- Double Top
- Triple Bottom
- Triple Bottom
- Triple Top
- Triple Top
- All
- All
- Buy
- Sale
- All
- 1
- 2
- 3
- 4
- 5
Teratas Triple
was formed on 18.04 at 22:15:20 (UTC+0)
signal strength 2 of 5

Pola Teratas Triple telah terbentuk pada grafik EURUSD M15. Fitur-fitur pola: perbatasan memiliki sudut yang naik; batas bawah pola memiliki koordinat 1.1387/1.1391 dengan batas atas 1.1397/1.1397; proyeksi lebar adalah
Rangka waktu M5 dan M15 mungkin memiliki lebih dari titik entri yang keliru.
Open chart in a new window
Persegi Bearish
was formed on 18.04 at 21:51:06 (UTC+0)
signal strength 2 of 5

Menurut grafik dari M15, NZDCAD terbentuk Persegi Bearish. Jenis pola ini menunjukkan kelanjutan tren. Terdiri dari dua tingkat: resistance 0.8222 - 0.0000 dan support 0.8206 – 0.8206. Jika level resistance
Rangka waktu M5 dan M15 mungkin memiliki lebih dari titik entri yang keliru.
Open chart in a new window
Bawah Ganda
was formed on 18.04 at 21:45:06 (UTC+0)
signal strength 2 of 5

Pola Bawah Ganda telah terbentuk pada USDJPY M15; batas atas di 142.30; batas bawah di 142.14. Lebar pola sebesar 17 poin. Jika harga menembus batas atas 142.30, Perubahan dalam tren
Rangka waktu M5 dan M15 mungkin memiliki lebih dari titik entri yang keliru.
Open chart in a new window


