

Pola sebenarnya

Bullish Symmetrical Triangle
was formed on 26.03 at 09:45:02 (UTC+0)
signal strength 1 of 5
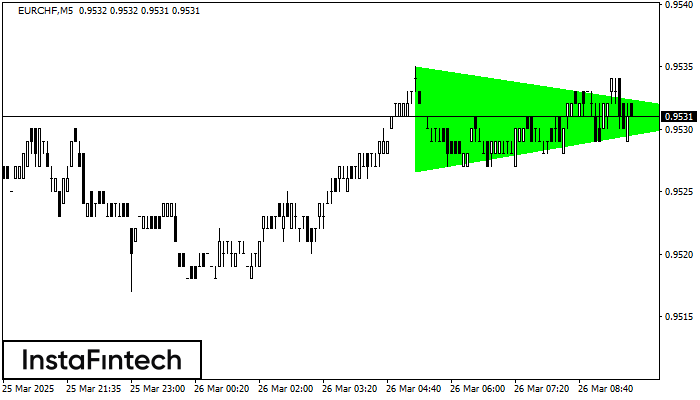
According to the chart of M5, EURCHF formed the Bullish Symmetrical Triangle pattern, which signals the trend will continue. Description. The upper border of the pattern touches the coordinates 0.9535/0.9531 whereas the lower border goes across 0.9527/0.9531. The pattern width is measured on the chart at 8 pips. If the Bullish Symmetrical Triangle pattern is in progress during the upward trend, this indicates the current trend will go on. In case 0.9531 is broken, the price could continue its move toward 0.9546.
The M5 and M15 time frames may have more false entry points.
Lihat juga
- All
- All
- Bearish Rectangle
- Bearish Symmetrical Triangle
- Bearish Symmetrical Triangle
- Bullish Rectangle
- Double Top
- Double Top
- Triple Bottom
- Triple Bottom
- Triple Top
- Triple Top
- All
- All
- Buy
- Sale
- All
- 1
- 2
- 3
- 4
- 5
Teratas Ganda
was formed on 22.04 at 06:46:04 (UTC+0)
signal strength 1 of 5
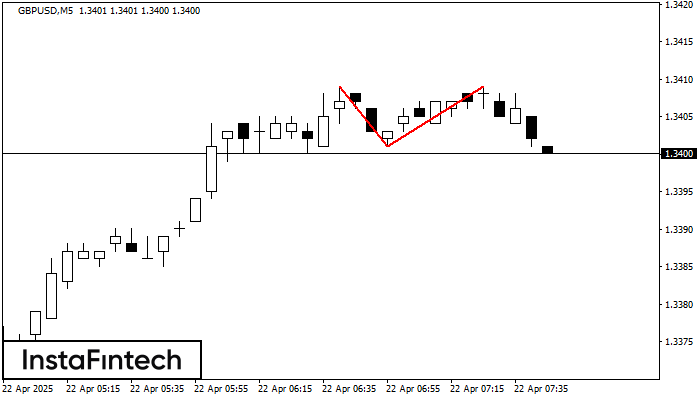
Pada grafik GBPUSD M5 pola reversal Teratas Ganda telah terbentuk. Karakteristik: batas atas 1.3409; batas bawah 1.3401; lebar pola 8 poin. Sinyal: tembusan ke batas bawah akan menyebabkan kelanjutan tren
Rangka waktu M5 dan M15 mungkin memiliki lebih dari titik entri yang keliru.
Open chart in a new window
Persegi Bearish
was formed on 22.04 at 06:31:47 (UTC+0)
signal strength 1 of 5
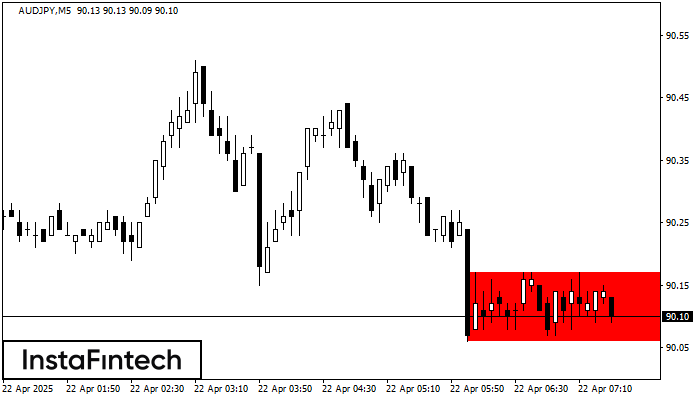
Menurut grafik dari M5, AUDJPY terbentuk Persegi Bearish. Jenis pola ini menunjukkan kelanjutan tren. Terdiri dari dua tingkat: resistance 90.17 - 0.00 dan support 90.06 – 90.06. Jika level resistance
Rangka waktu M5 dan M15 mungkin memiliki lebih dari titik entri yang keliru.
Open chart in a new window
Bawah Ganda
was formed on 22.04 at 06:10:16 (UTC+0)
signal strength 1 of 5
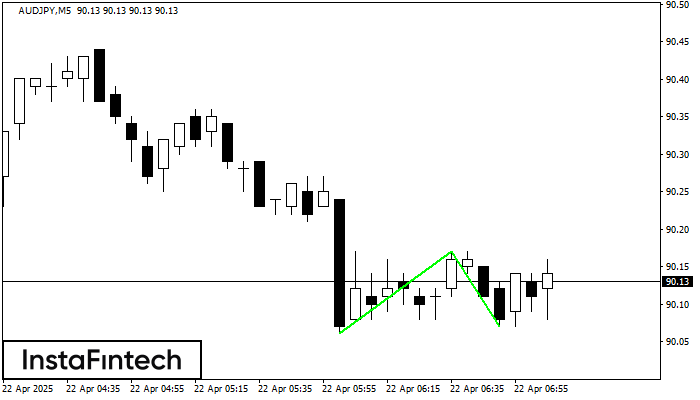
Pola Bawah Ganda telah terbentuk pada AUDJPY M5. Formasi ini mensinyalkan reversal tren dari arah penurunan ke arah kenaikan. Sinyal menunjukkan bahwa transaksi beli harus dibuka setelah batas atas pola
Rangka waktu M5 dan M15 mungkin memiliki lebih dari titik entri yang keliru.
Open chart in a new window


