Lihat juga


 31.03.2025 05:20 AM
Market participants have again been gripped by fear due to Washington's intention to expand tariff duties by 20% on virtually all U.S. trading partners. On Friday, the S&P 500 stock index plunged by 1.97%, and now the equity market may take the lead in shaping risk sentiment. If that happens, the euro may not withstand the pressure and could follow a medium-term downward trend.
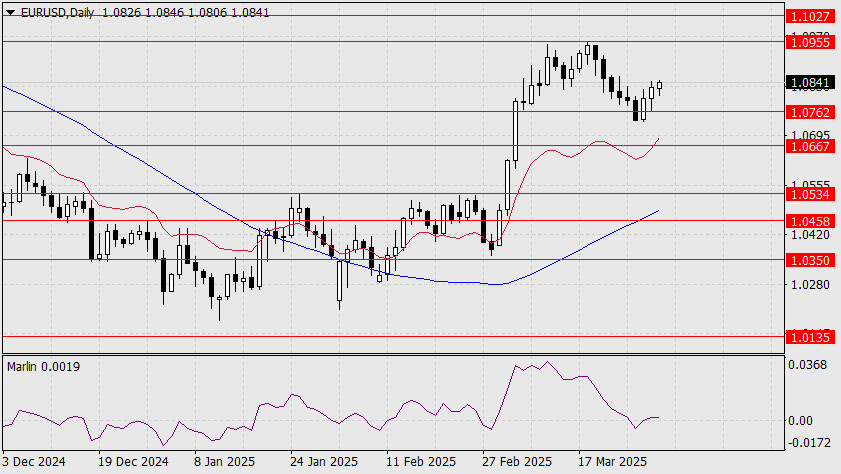
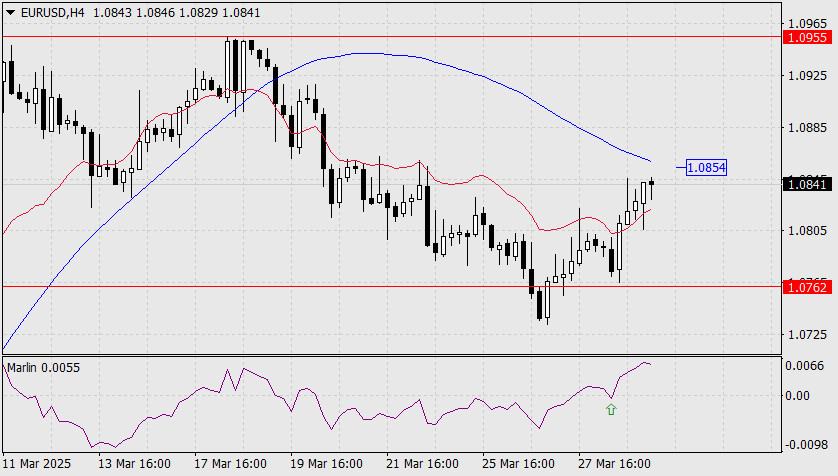
On the daily chart, the single currency continues to climb. The signal line of the Marlin oscillator has entered positive territory, and formally, the price is moving toward the target level of 1.0955. There is time for this move, as the key developments are expected on April 3, when the new tariffs take effect. Investors will then begin reassessing risks based on those measures.On the four-hour chart, the price is approaching the MACD line. This is a timely signal, as a consolidation above this resistance level would indicate that the bulls are ready to continue the rally toward 1.0955. The initial impulse came from the Marlin oscillator reversing off the zero line.
The nearest support level is 1.0762. A break below it would open the way to the 1.0667 target. The direction of the S&P 500 index will influence the sustainability of the trend in either direction. For now, the situation remains uncertain.
You have already liked this post today
*Analisis pasar yang diposting disini dimaksudkan untuk meningkatkan pengetahuan Anda namun tidak untuk memberi instruksi trading.
Dengan kondisi Stochastic Oscillator yang tengah menuju ke level Oversold (20) pada chart 4 jam dari pasangan mata uang silang AUD/JPY, maka dalam waktu dekat ini AUD/JPY berpotensi untuk melemah
Pada chart 4 jamnya, pasangan mata uang komoditi USD/CAD nampak terlihat bergerak dibawah EMA (100) serta munculnya pola Bearish 123 serta posisi indikator Stochastic Oscillator yang sudah berada diatas level
Pada awal sesi Amerika, emas diperdagangkan sekitar 3.220, menunjukkan tanda-tanda kelelahan. Koreksi teknis lebih lanjut menuju 21SMA kemungkinan akan terjadi dalam beberapa jam ke depan. Pada grafik H4, kita dapat
Dengan munculnya Divergence antara pergerakan harga pasangan mata uang silang EUR/JPY dengan indikator Stochastic Oscillator juga diikuti oleh hadirnya pola Bullish 123 yang diikuti oleh Bullish Ross Hook (RH)
Pada chart 4 jamnya, pasangan mata uang silang GBP/AUD nampak terlihat bergerak dibawah EMA (21)-nya dan indikator Stochastic Oscillator dalam kondisi Crossing SELL, maka dalam waktu dekat berdasarkan kedua info
 InstaFutures
Make money with a new promising instrument!
Notifikasi
E-mail/SMS

Your IP address shows that you are currently located in the USA. If you are a resident of the United States, you are prohibited from using the services of InstaFintech Group including online trading, online transfers, deposit/withdrawal of funds, etc.
If you think you are seeing this message by mistake and your location is not the US, kindly proceed to the website. Otherwise, you must leave the website in order to comply with government restrictions.
Why does your IP address show your location as the USA?
Please confirm whether you are a US resident or not by clicking the relevant button below. If you choose the wrong option, being a US resident, you will not be able to open an account with InstaTrade anyway.
We are sorry for any inconvenience caused by this message.


