See also

 31.03.2025 11:12 AM
EUR/USD
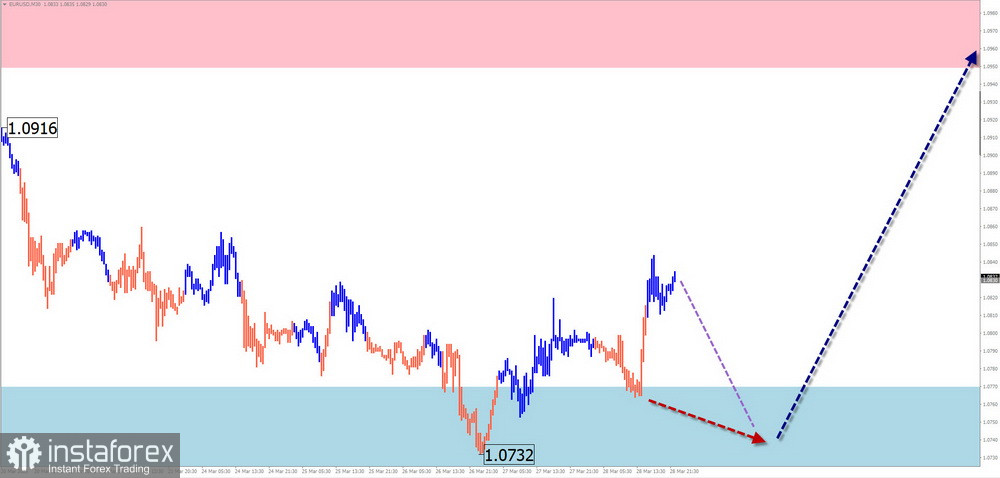
Analysis: In the short term, the EUR/USD pair has been following the path of the latest upward wave that began on February 3 of this year. In recent weeks, the price has been forming a correction in the form of an extended flat. As of now, the wave structure remains incomplete. The pair is currently trading near the lower boundary of the potential reversal zone on the daily time frame.
Forecast: A completion of the euro's downward movement is expected in the coming days, possibly down to the calculated support zone. A reversal and renewed price growth are anticipated in the second half of the week. The calculated resistance will act as the upper boundary of the weekly price range.
Potential Reversal Zones Resistance:
Recommendations:
USD/JPY
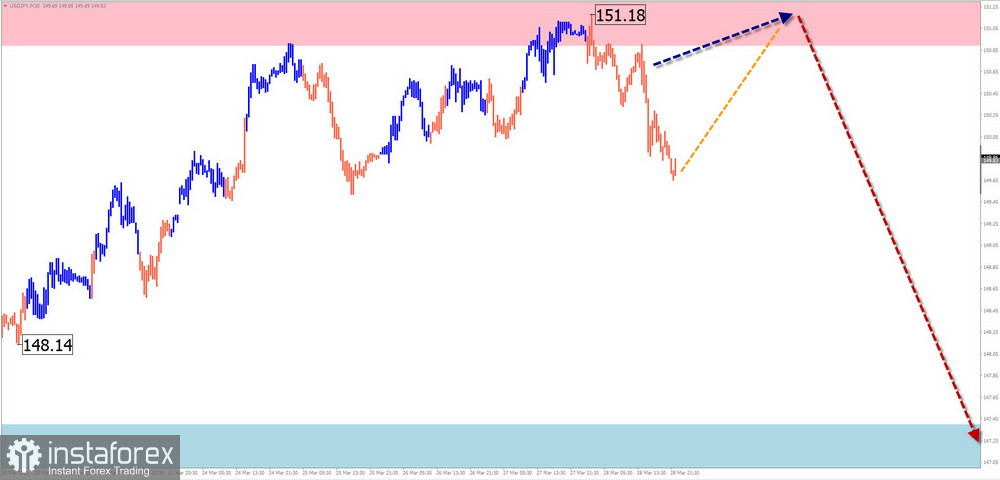
Analysis: The bullish wave that began in August last year sets the primary direction for USD/JPY. Since mid-December, a corrective (B) wave has been forming. Over the past three weeks, a sideways intermediate pullback has been developing within this structure.
Forecast: Sideways price action is expected to continue for the next couple of days. Brief pressure toward the upper boundary of the calculated resistance is possible. Increased volatility, a reversal, and a renewed downward move are expected closer to the weekend.
Potential Reversal Zones Resistance:
Recommendations:
GBP/JPY
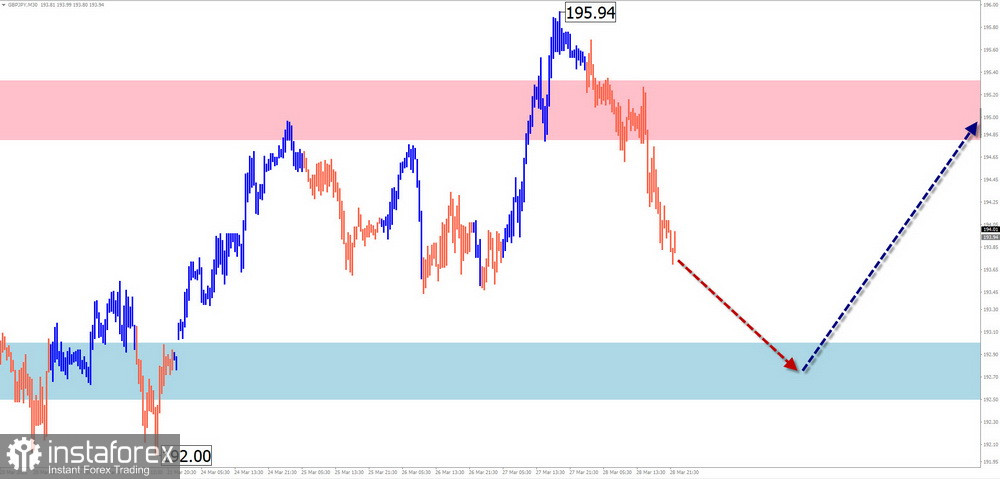
Analysis: Since February, the short-term trend of GBP/JPY has been shaped by an upward wave. From strong resistance, the price has started to pull back since late last week, forming the beginning of a corrective (B) wave. The price has reached another support level.
Forecast: Sideways movement near the potential reversal zone is expected in the next few days. Brief pressure on the lower boundary of the support zone is possible. A trend reversal and renewed upward momentum are likely by the end of the week. Growth will be capped by calculated resistance.
Potential Reversal Zones Resistance:
Recommendations:
USD/CAD
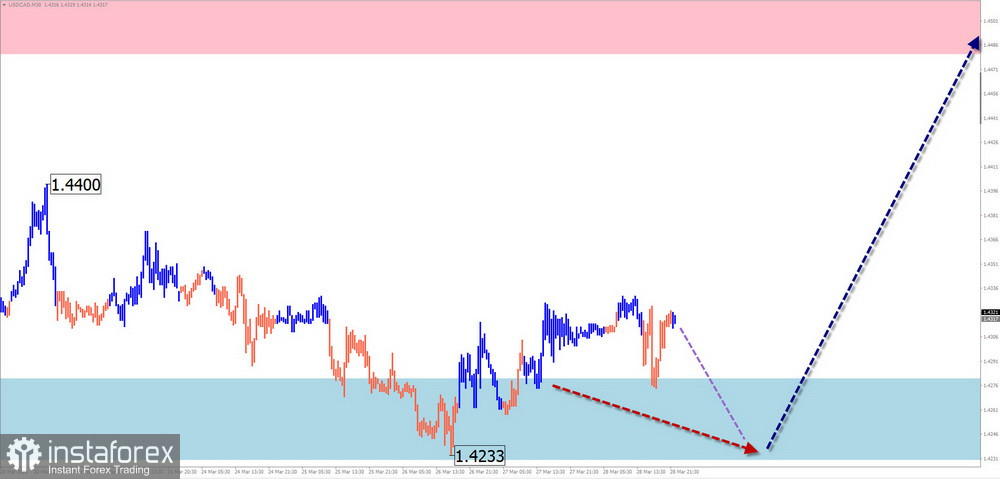
Analysis: The current wave pattern for USD/CAD has been trending downward since February. Recent structure analysis shows the formation of the middle segment of wave (B), which is forming as a flat and remains incomplete.
Forecast: Sideways movement is expected to continue throughout the week. A downward bias is likely in the first half, potentially pressuring support. A reversal and upward momentum are expected by the end of the week.
Potential Reversal Zones Resistance:
Recommendations:
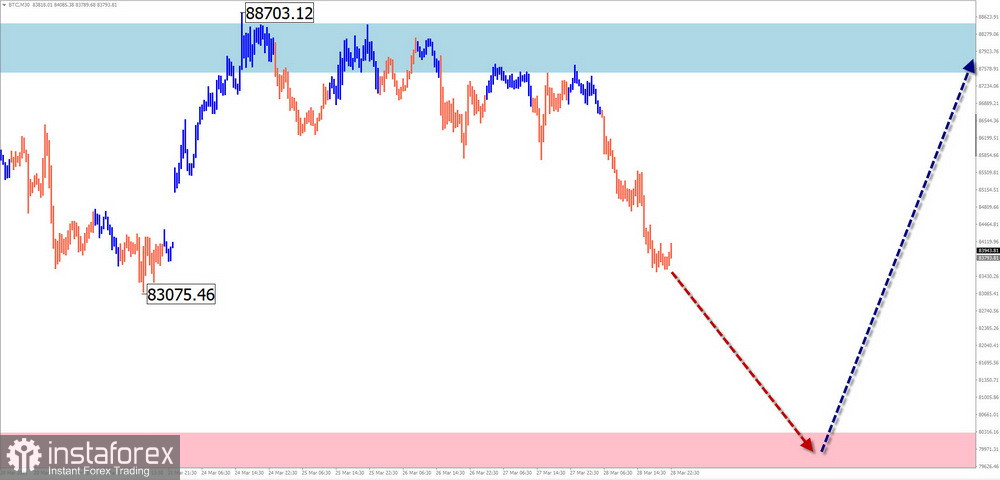
#Bitcoin
Analysis: In the short term, Bitcoin's direction has been governed by a downward wave since December. On a larger scale, this represents a correction within the dominant trend. The structure is still incomplete, with prices approaching the upper boundary of a significant weekly reversal zone.
Forecast: A continuation of overall sideways movement is expected next week. A bearish bias is likely at the start of the week, potentially down to the calculated support zone. A reversal and rally toward the resistance zone could follow, with most activity expected closer to the weekend.
Potential Reversal Zones Resistance:
Recommendations:
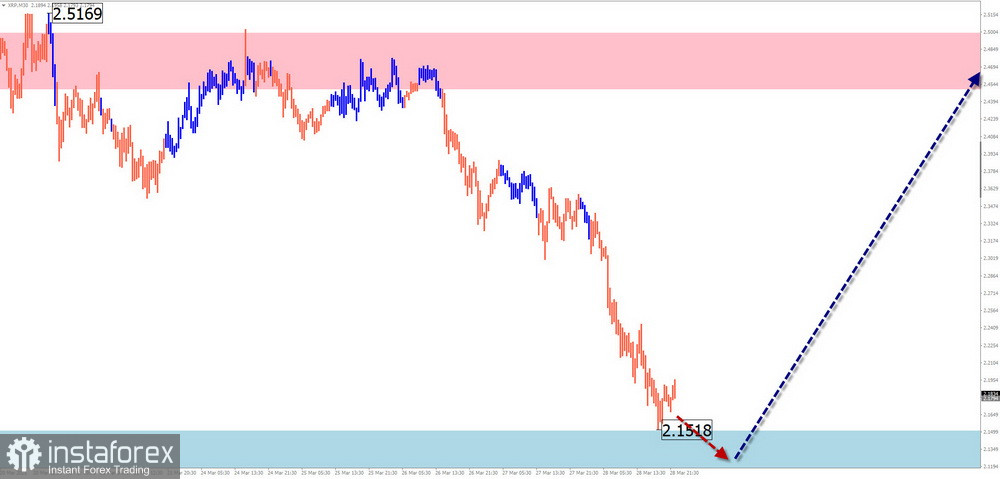
#Ripple
Analysis: In the short term, Ripple has been in a bearish wave since the beginning of the month. This wave is primarily forming as a sideways flat. A corrective segment is developing and remains incomplete. The price is near the upper boundary of the potential reversal zone.
Forecast: Pressure on the support zone is possible in the coming days, including a brief breach of the lower boundary. A reversal and directional shift in price movement are more likely closer to the weekend. The calculated resistance limits the upward potential.
Potential Reversal Zones Resistance:
Recommendations:
Note: In simplified wave analysis (SWA), all waves consist of three parts (A-B-C). The analysis on each time frame focuses on the last incomplete wave. Dotted lines indicate expected price movements.
Disclaimer: The wave algorithm does not take into account the duration of instrument movements over time.


