See also


 21.02.2025 01:12 PM
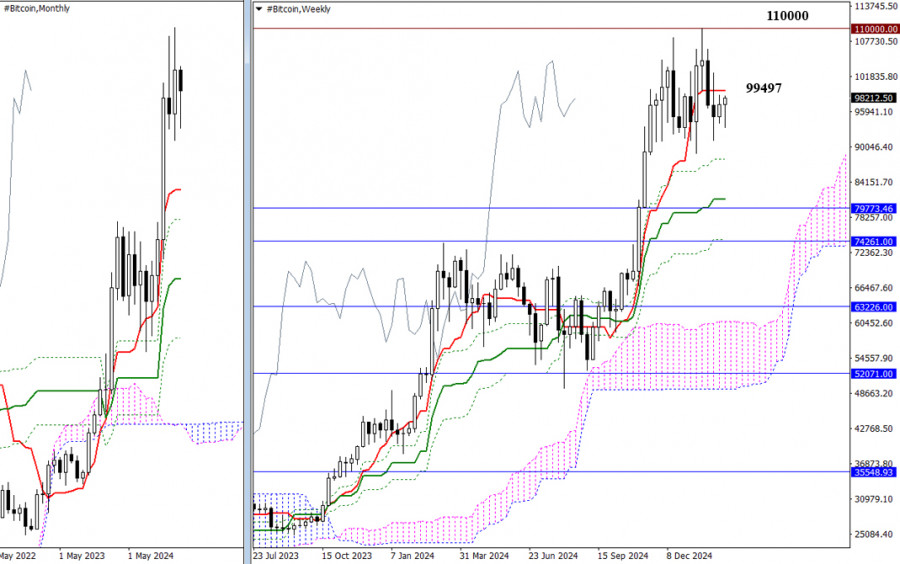
Another Friday has arrived, yet Bitcoin continues to remain in a wait-and-see mode. The price range remains narrow, with the market holding below the short-term weekly trend resistance at 99,497. As a result, there have been no significant changes in the overall market outlook. For bullish traders, the key objectives remain the same: reclaiming control over the short-term weekly trend and pushing the price towards the psychological resistance at 110,000.
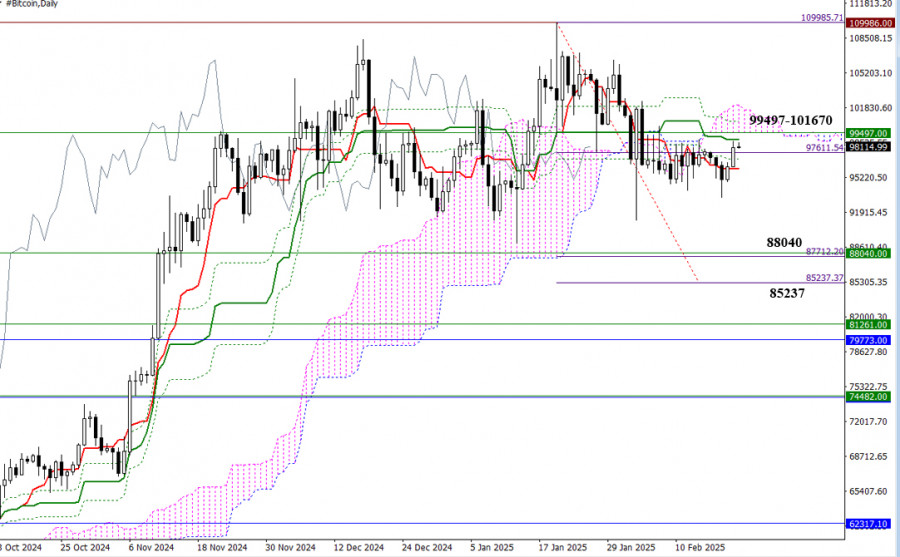
On the daily timeframe, breaking above the 99,497 level will require bulls to simultaneously neutralize the daily death cross at 100,587 and establish a position above the daily Ichimoku cloud (99,497 – 101,670). On the other hand, if bearish traders gain momentum and successfully restore the downtrend at 91,161, the next targets will be a test of the nearest weekly support at 88,040 and fulfilling the daily breakdown target within the 87,712 – 85,237 range.
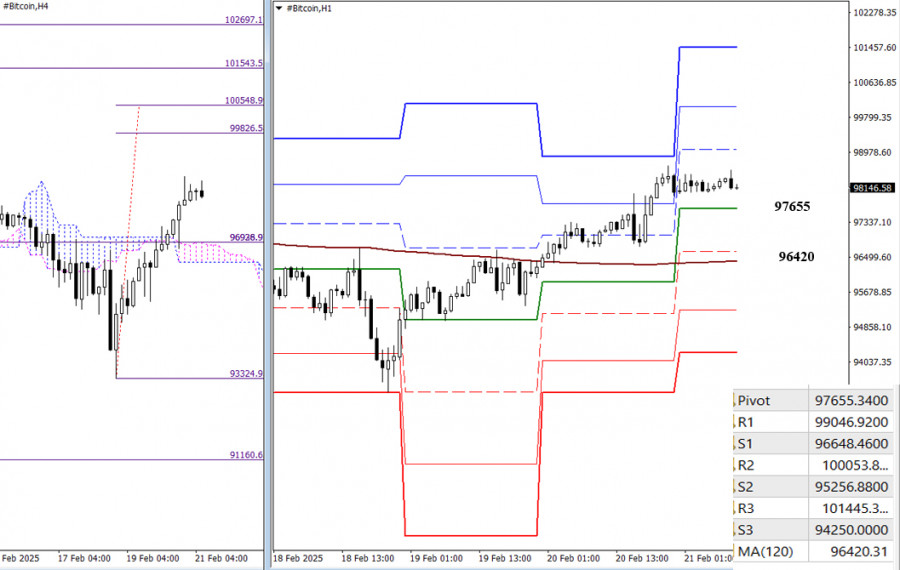
On lower timeframes, bullish traders currently have the upper hand. Interestingly, several upward targets exist for further price increases. These include the classic Pivot resistance levels at 99,047 – 100,054 – 101,445, along with two breakout targets within the H4 Ichimoku cloud. Since the current low is not the final one before breaking the cloud, the first H4 target zone is at 99,827 – 100,549, while the second extends to 101,544 – 102,697.
If the market moves downward, the initial support levels are at 97,655 (central daily Pivot level) and 96,420 (weekly long-term trend). Below these, additional supports from the classic Pivot levels at 95,257 and 94,250 will come into play.
Technical Indicators Used
You have already liked this post today
*The market analysis posted here is meant to increase your awareness, but not to give instructions to make a trade.
Bitcoin and Ethereum remain within their sideways channels, and the inability to break out of these ranges could jeopardize the prospects for a broader recovery in the cryptocurrency market. However
After successfully exiting the Ascending Broadening Wedge pattern on the 4-hour chart of the Litecoin cryptocurrency followed by the appearance of Divergence between the Litecoin price movement and the Stochastic
Pressure on the cryptocurrency market returned yesterday after traders and investors triggered a sell-off in the U.S. stock market. As I've noted repeatedly, the correlation between these two markets
Over the past weekend, Bitcoin and Ethereum demonstrated decent resilience, maintaining a chance for further recovery. While from a technical standpoint, those chances may appear rather slim, trading within
Bitcoin and Ethereum dropped in value toward the end of Thursday's U.S. session but recovered during today's Asian trading hours. It has become common practice that the crypto market declined
With the appearance of divergence between the price movement of the Polkadot cryptocurrency and the Stochastic Oscillator indicator on its 4-hour chart, as long as there is no weakening correction
InstaTrade
PAMM accounts

Your IP address shows that you are currently located in the USA. If you are a resident of the United States, you are prohibited from using the services of InstaFintech Group including online trading, online transfers, deposit/withdrawal of funds, etc.
If you think you are seeing this message by mistake and your location is not the US, kindly proceed to the website. Otherwise, you must leave the website in order to comply with government restrictions.
Why does your IP address show your location as the USA?
Please confirm whether you are a US resident or not by clicking the relevant button below. If you choose the wrong option, being a US resident, you will not be able to open an account with InstaTrade anyway.
We are sorry for any inconvenience caused by this message.


