See also


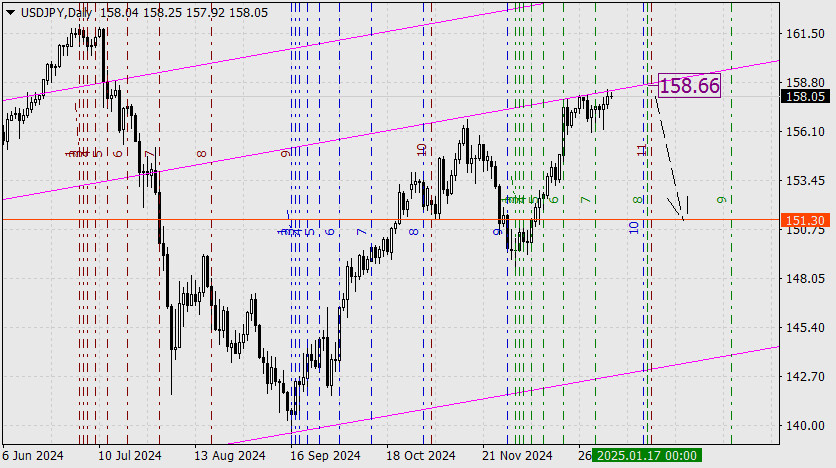
On the weekly chart, the price continues to hover near the light lavender price channel line. It has the potential to reach the 158.66 level, although it may fall short.
A key factor to consider is the timing associated with the convergence of three Fibonacci time lines on January 17. Given the upcoming weekend, this aligns with January 23–24, which coincides with the Bank of Japan's meeting. We believe that during this meeting, there may be an announcement regarding either a rate hike or some form of intervention. A price reversal from these levels is technically likely, with the target set at 151.30, which is the low from November 6.
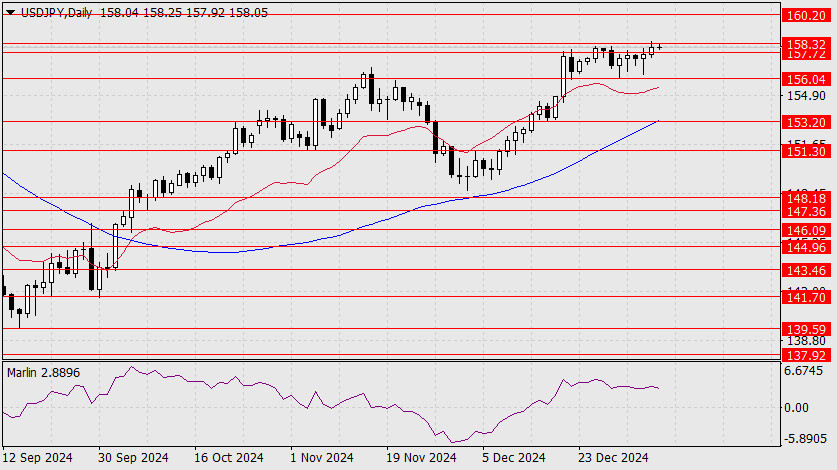
On the daily chart, the price is consolidating within the range of 157.72 to 158.32. The Marlin oscillator is not showing signs of upward movement, although it may form a weak divergence with the price.
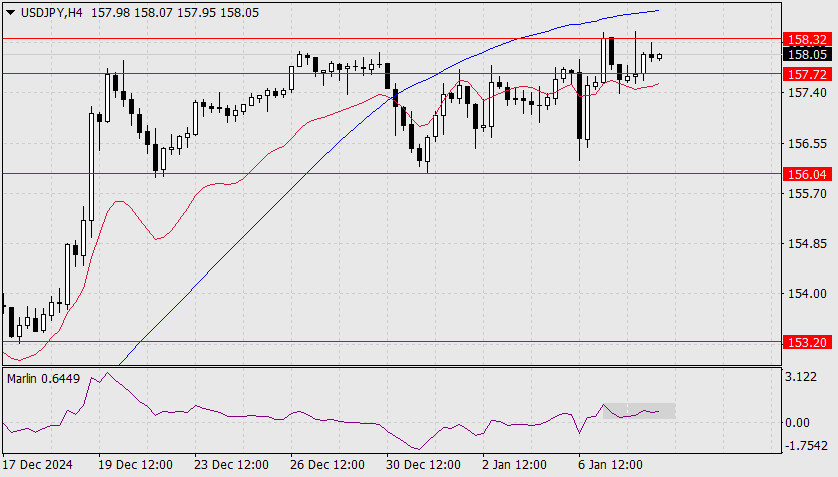
On the four-hour chart, the price is also consolidating between the balance line and the MACD line, remaining within the same range of 157.72 to 158.32. The Marlin oscillator is moving sideways. This consolidation is expected to continue for a few more days, likely featuring brief breakouts in both directions.
You have already liked this post today
*The market analysis posted here is meant to increase your awareness, but not to give instructions to make a trade.


