See also


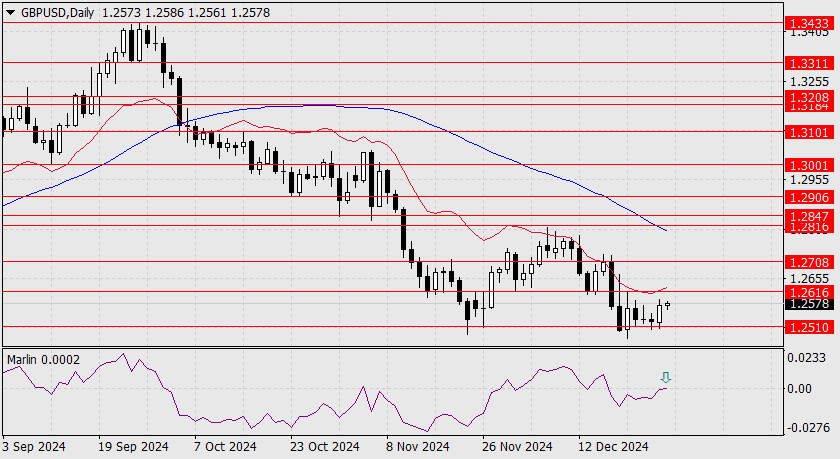
On the daily chart, the price has slightly rebounded from the 1.2510 support level. This bounce represents the price's development within the consolidation range of 1.2510-1.2616. Friday's movement allowed the Marlin oscillator's indicator line to reach the neutral zero line. From this point, a reversal is likely, with the price following the direction indicated by the oscillator. If the price breaks below the 1.2510 support level, it could lead to a decline towards 1.2367.
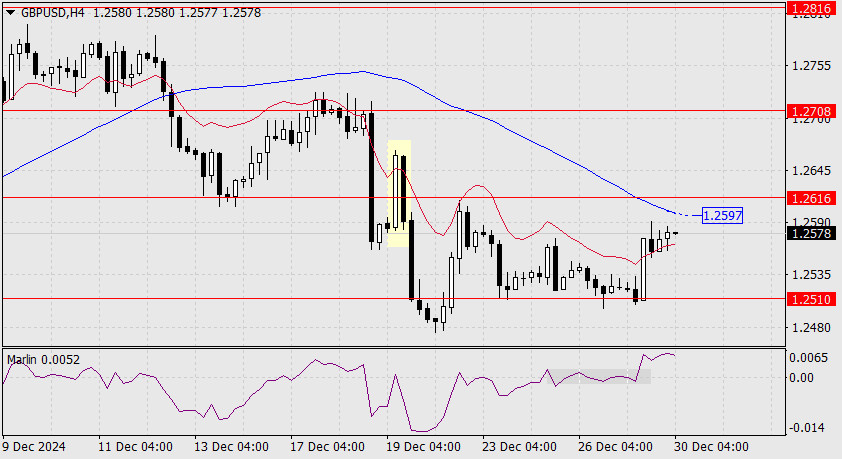
On the H4 chart, the Marlin oscillator has moved upward after a brief period of consolidation at the zero line. However, further progress of the oscillator and price movement is being hindered by two resistance levels: the MACD line at 1.2597 and the target level at 1.2616.
The price may approach these resistance levels due to consolidating above the balance line, indicated by the red moving average. However, we are skeptical that the price will maintain its position above these resistance levels. If it does, we could see a pattern similar to what was observed on December 19, highlighted by the yellow rectangle.
You have already liked this post today
*The market analysis posted here is meant to increase your awareness, but not to give instructions to make a trade.


