See also


 02.12.2024 05:16 AM
USD/JPY
Higher Timeframes:
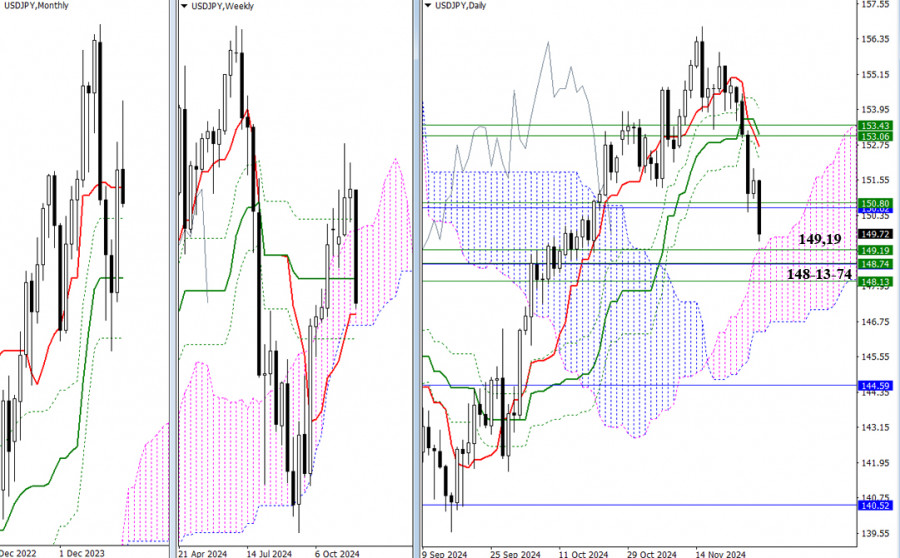
Last week delivered a significant bearish outcome. Gains achieved over several weeks, during which bulls attempted to regain control and continue the upward movement, were erased and are now history. Several strong support levels currently block further bearish progress, forming a zone within 149.19 – 148.74 – 148.13 (weekly short-term trend, lower boundary of the Ichimoku weekly cloud, and Fibonacci Kijun levels for the week and month). A breakout below this zone would open new bearish perspectives, such as a decline toward the lower boundary of the daily Ichimoku cloud (146.74) and the formation of a daily target. Beyond this, attention would drop toward the monthly medium-term trend (144.59).
If a rebound occurs, the yen is likely first to attempt to reclaim the nearest resistance at 150.78 (weekly medium-term trend + monthly short-term trend) and then aim for the levels of the daily cross strengthened by weekly resistances (153.06 – 153.43).
In addition to the weekly performance, the November monthly candle closed with a distinctly bearish character, suggesting sustained downward momentum and further strengthening of bearish sentiment.
***
Higher Timeframes:
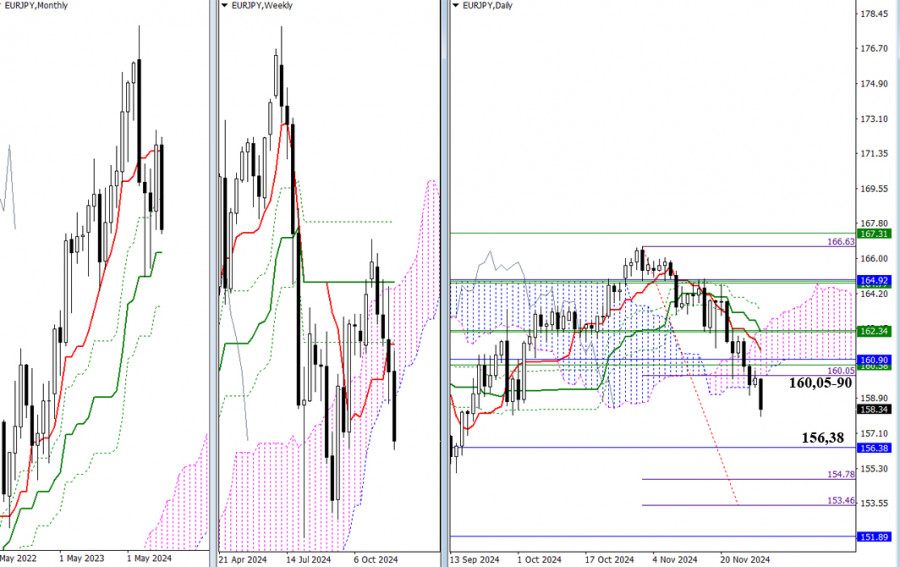
November ended with a rebound from the monthly short-term trend (164.87), marking a strong performance by the bears. On the weekly timeframe, the bears successfully exited the cloud region (160.05) and closed the week firmly in bearish territory relative to the Ichimoku cloud. The next task is to confirm this result and form a weekly target for breaking through the Ichimoku cloud.
In the daily timeframe, bears also managed to exit the cloud and establish a daily target for a break below the Ichimoku cloud (154.78 – 153.46). Beyond the daily target, the bearish focus would shift to monthly supports at 156.38 – 151.89 in the event of further decline.
Should sentiment shift, bulls would aim to restore their positions by returning to the Ichimoku cloud (160.05) and moving toward its upper boundaries on the daily (164.61) and weekly (162.98) timeframes. Within the cloud, resistance levels of the daily death cross, currently located at 161.29 (Tenkan) and 162.31 (Kijun), are also notable. As the pair rises, these targets will be tested for strength, and overcoming them with a reliable consolidation above would open new bullish prospects.
***
Technical Tools Used for Analysis:
You have already liked this post today
*The market analysis posted here is meant to increase your awareness, but not to give instructions to make a trade.
Useful links: My other articles are available in this section InstaForex course for beginners Popular Analytics Open trading account Important: The begginers in forex trading need to be very careful
Useful links: My other articles are available in this section InstaForex course for beginners Popular Analytics Open trading account Important: The begginers in forex trading need to be very careful
From what we see on the 4-hour chart of the Nasdaq 100 index, there are several interesting things, namely, first, the price movement is moving below the MA (100), second
Early in the American session, gold is trading around 3,312 with a bullish bias after breaking out of the symmetrical triangle. Gold is now likely to continue rising
Useful links: My other articles are available in this section InstaForex course for beginners Popular Analytics Open trading account Important: The begginers in forex trading need to be very careful
On the 4-hour chart, the USD/CAD commodity currency pair can be seen moving below the EMA (100) and the appearance of a Bearish 123 pattern and the position
Training video

Your IP address shows that you are currently located in the USA. If you are a resident of the United States, you are prohibited from using the services of InstaFintech Group including online trading, online transfers, deposit/withdrawal of funds, etc.
If you think you are seeing this message by mistake and your location is not the US, kindly proceed to the website. Otherwise, you must leave the website in order to comply with government restrictions.
Why does your IP address show your location as the USA?
Please confirm whether you are a US resident or not by clicking the relevant button below. If you choose the wrong option, being a US resident, you will not be able to open an account with InstaTrade anyway.
We are sorry for any inconvenience caused by this message.


